
记得加转义字符
标签: linux
heapsort快速排序
void sort(float arr[], unsigned int N)
  { // heapsort algorithm
      unsigned int n = N, i = n/2, parent, child;
      int t;

      for (;;) { /* Loops until arr is sorted */
          if (i > 0) { /* First stage - Sorting the heap */
              i--;           /* Save its index to i */
              t = arr[i];    /* Save parent value to t */
          } else {     /* Second stage - Extracting elements in-place */
              n--;           /* Make the new heap smaller */
              if (n == 0) return; /* When the heap is empty, we are done */
              t = arr[n];    /* Save last value (it will be overwritten) */
              arr[n] = arr[0]; /* Save largest value at the end of arr */
          }

          parent = i; /* We will start pushing down t from parent */
          child = i*2 + 1; /* parent's left child */

          /* Sift operation - pushing the value of t down the heap */
          while (child < n) {
              if (child + 1 < n  &&  arr[child + 1] > arr[child]) {
                  child++; /* Choose the largest child */
              }
              if (arr[child] > t) { /* If any child is bigger than the parent */
                  arr[parent] = arr[child]; /* Move the largest child up */
                  parent = child; /* Move parent pointer to this child */
                  //child = parent*2-1; /* Find the next child */
                  child = parent*2+1; /* the previous line is wrong*/
              } else {
                  break; /* t's place is found */
              }
          }
          arr[parent] = t; /* We save t in the heap */
      }
}二分法查找
#include <math.h>

int ifindi(int n,int arr[],int v)
{
    int i,begin=0,end=n-1,mid;

    if(v<arr[0] || v>arr[n-1])
        return -9;
    if(n<=0)
        return -9;

//    mid=rint((end-begin)/2);
    while(1)
    {
        if((end-begin)<=1){
            if(arr[begin]==v) return begin;
            if(arr[end]==v) return end;
        }
        mid=begin+rint((end-begin)/2);
//        printf("mid=%d\n",mid);
        if(v>=arr[begin] && v<arr[mid]) end=mid;
        if(v>=arr[mid] && v<=arr[end]) begin=mid;
//        printf("begin=%d, end=%d\n",begin,end);
    }
}python-判断线段与多边形相交
import numpy as np
import matplotlib.pyplot as plt
import shapely.geometry
import descartes

circle = shapely.geometry.Point(5.0, 0.0).buffer(10.0)
clip_poly = shapely.geometry.Polygon([[-9.5, -2], [2, 2], [3, 4], [-1, 3]])
clipped_shape = circle.difference(clip_poly)

line = shapely.geometry.LineString([[-10, -5], [15, 5]])
line2 = shapely.geometry.LineString([[-10, -5], [-5, 0], [2, 3]])

print 'Blue line intersects clipped shape:', line.intersects(clipped_shape)
print 'Green line intersects clipped shape:', line2.intersects(clipped_shape)

fig = plt.figure()
ax = fig.add_subplot(111)

ax.plot(*np.array(line).T, color='blue', linewidth=3, solid_capstyle='round')
ax.plot(*np.array(line2).T, color='green', linewidth=3, solid_capstyle='round')
ax.add_patch(descartes.PolygonPatch(clipped_shape, fc='blue', alpha=0.5))
ax.axis('equal')

plt.show()
Blue line intersects clipped shape: True
Green line intersects clipped shape: False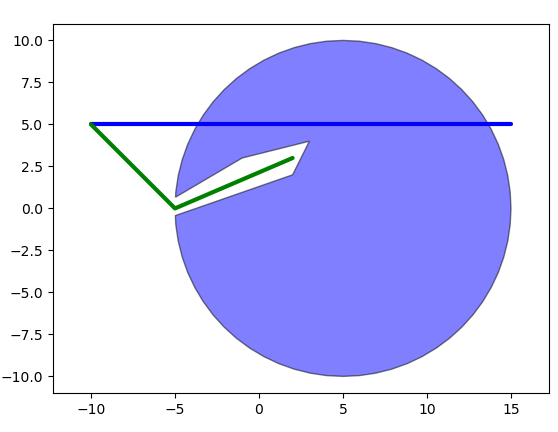
python矢量化运算更快速
#coding=utf-8
import core, time, swifter
import numpy as np
from geopy.distance import great_circle

cata=core.read_cata('cata202110.zmap',cata_type='zmap')
####################################################
time1=time.time()
d=cata.apply(lambda x:great_circle((30,102),(x['evla'],x['evlo'])).km,axis=1)
time2=time.time()
print('pandas apply time: ',time2-time1)

####################################################
#time3=time.time()
#d=cata.swifter.apply(lambda x:great_circle((30,102),(x['evla'],x['evlo'])).km,axis=1)
#time4=time.time()
#print('swifter apply time: ',time4-time3)

####################################################
arr=np.array(cata[['evla','evlo']])
time5=time.time()
d=np.apply_along_axis(lambda x:great_circle((30,102),(x[0],x[1])),axis=1,arr=arr)
time6=time.time()
print('numpy apply time: ',time6-time5)

###################################################
def myfunc(a,b,c,d):
    return great_circle((a,b),(c,d)).km

vfunc=np.vectorize(myfunc)
time7=time.time()
d=vfunc(arr[:,0],arr[:,1],30,102)
time8=time.time()
print('numpy vectorize time: ',time8-time7)
obspy中的时间
from obspy.core import UTCDateTime
t1=UTCDateTime(‘2021-10-19T09:24:56.32’)
t2= UTCDateTime(‘20211019092456.32’)
t3= UTCDateTime(‘2021-10-19 09:24:56.32’)
t4= UTCDateTime(‘20211019 092456.32’)
ts=t1.timestamp # 1634635496.32
t4=UTCDateTime(ts) # UTCDateTime(2021, 10, 19, 9, 24, 56, 320000)
t5=t1+3600 # UTCDateTime(2021, 10, 19, 10, 24, 56, 320000)
t5-t1 # 3600.0
t1.year
t1.julday
t1.weekday
t1.month
t1.day
t1.hour
t1.minute
t1.second
t1.microsecond
obspy中的UTCDateTime提供比默认的datetime更高精度的时间表达与计算。
matplotlib设置坐标轴标注格式
import matplotlib.dates as mdates
axes.xaxis.set_major_formatter(mdates.DateFormatter(‘%Y-%m’))
matplotlib旋转坐标轴标注
有如下几种方式:
plt.xticks(rotation= )旋转 Xticks 标签文本fig.autofmt_xdate(rotation= )旋转 Xticks 标签文本ax.set_xticklabels(xlabels, rotation= )旋转 Xticks 标签文本plt.setp(ax.get_xticklabels(), rotation=)旋转 Xticks 标签文本ax.tick_params(axis='x', labelrotation= )旋转 Xticks 标签文本