
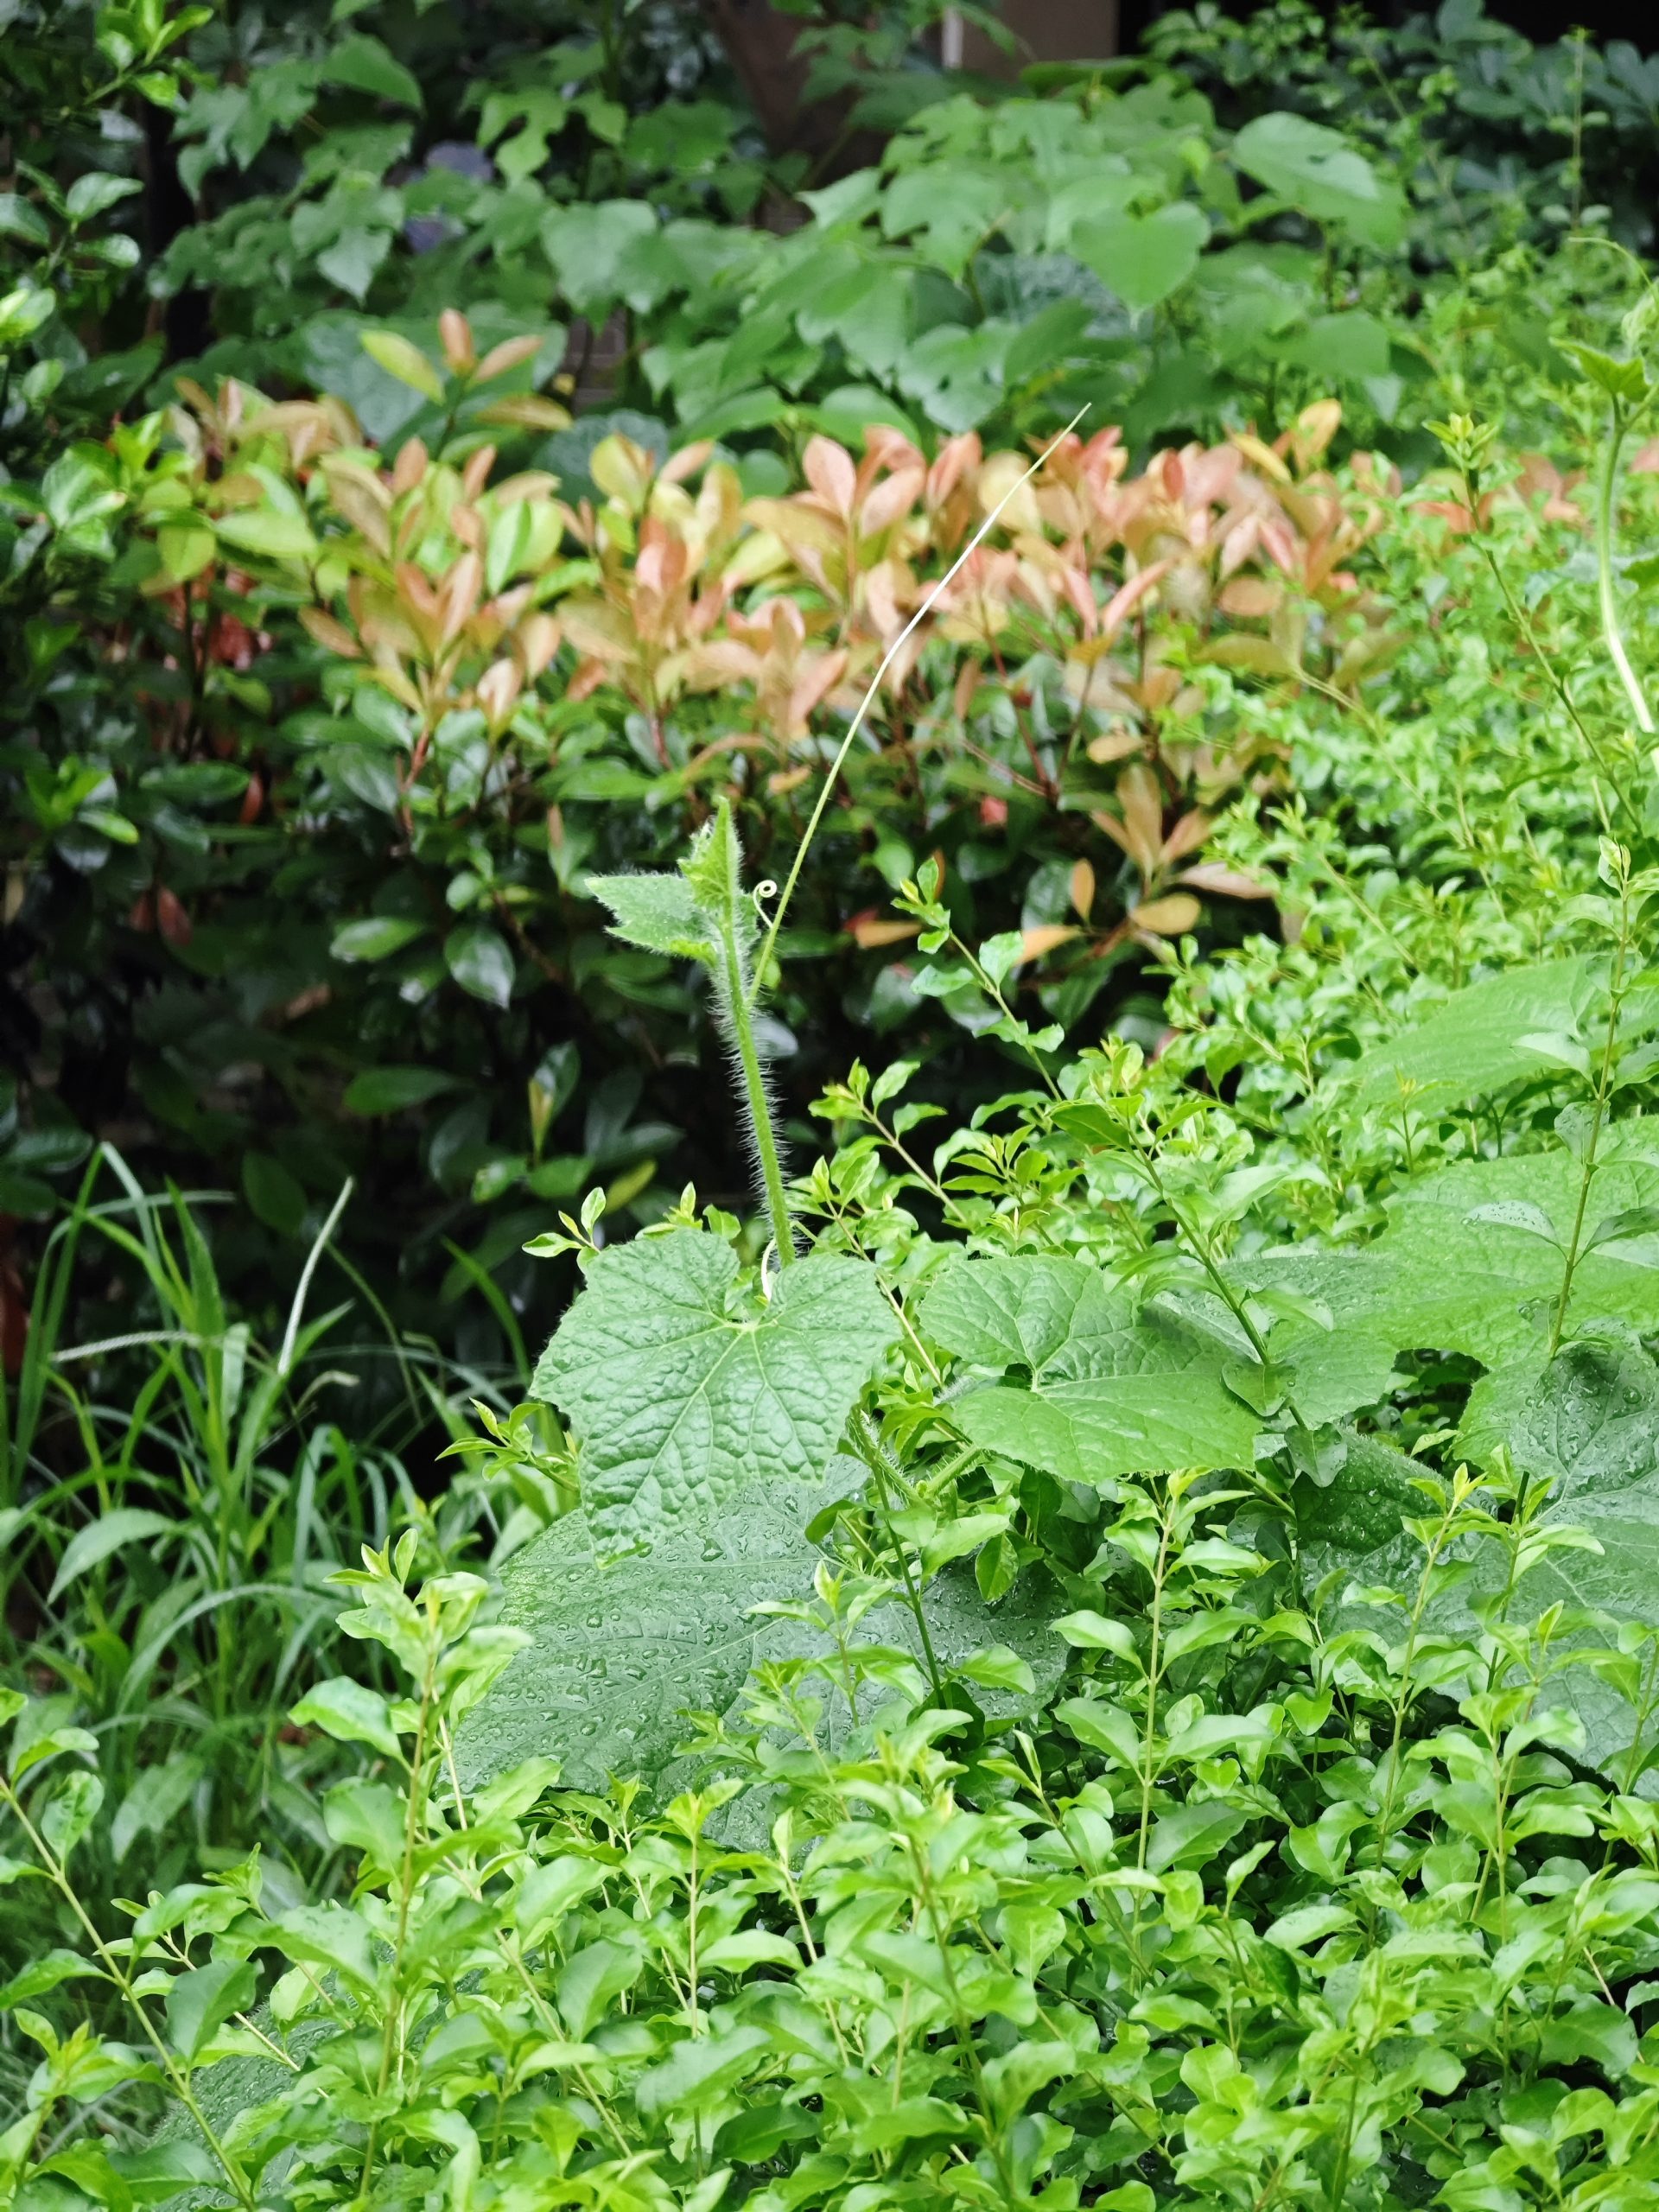
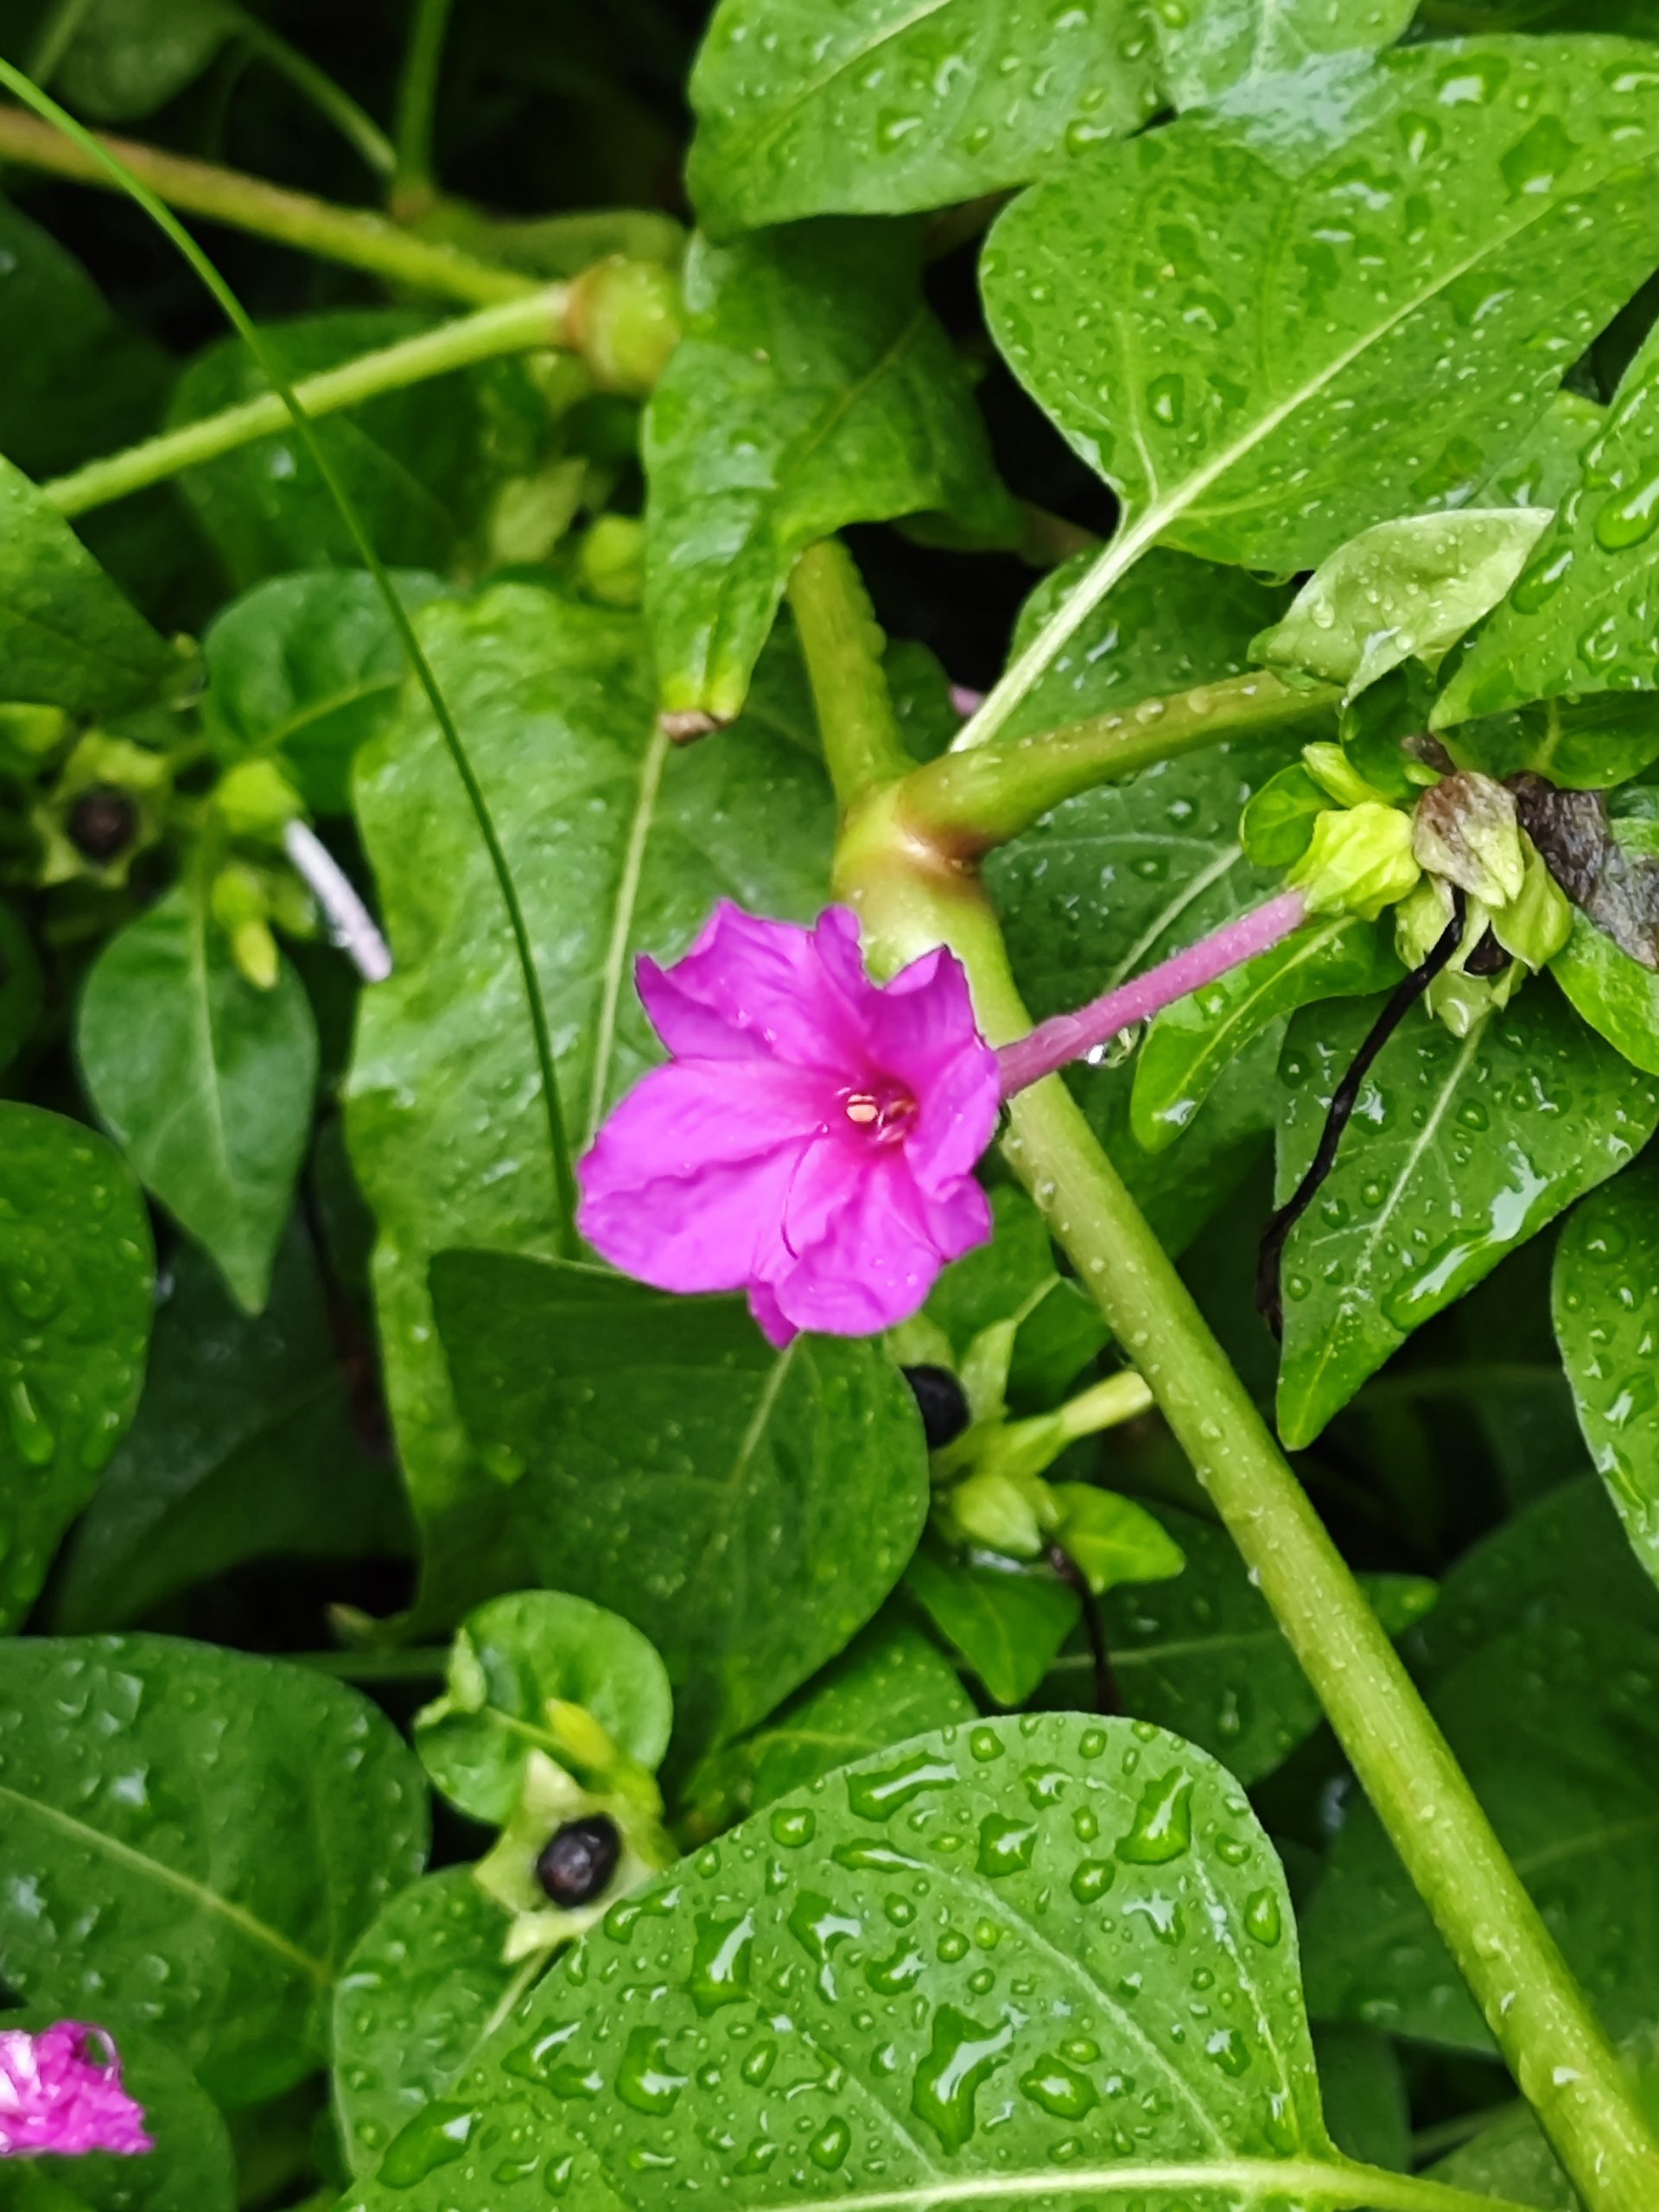
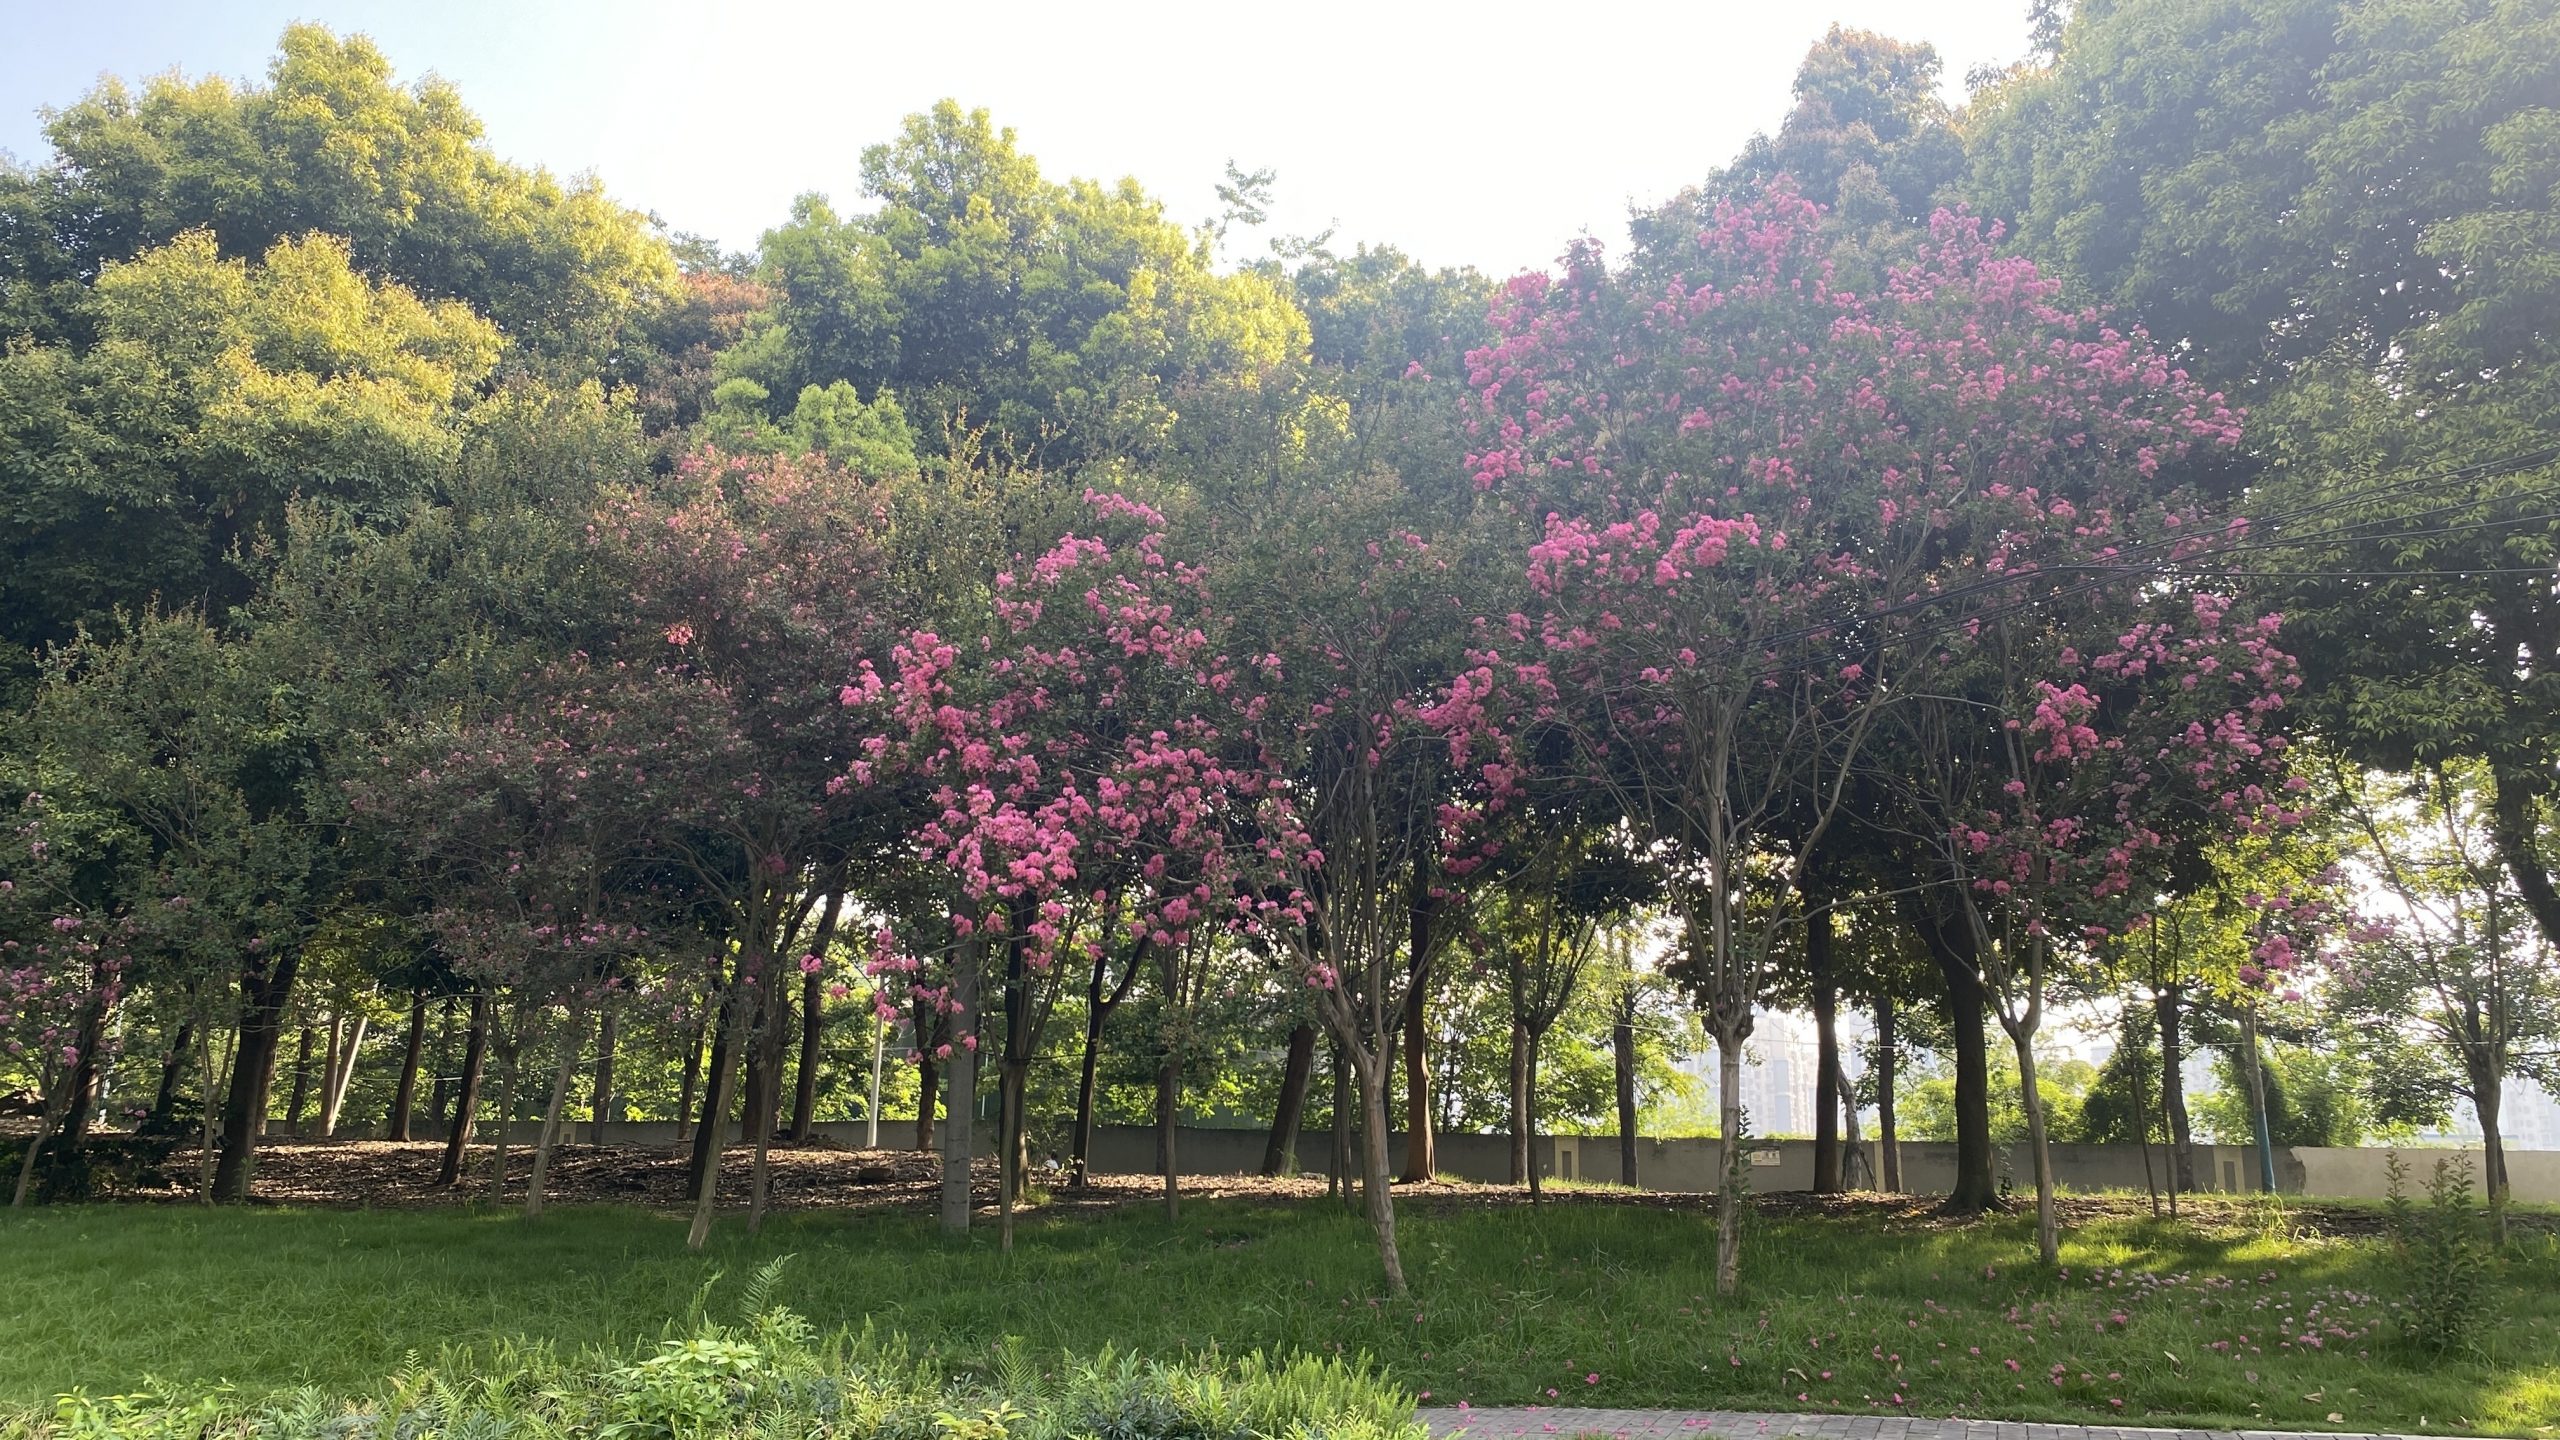

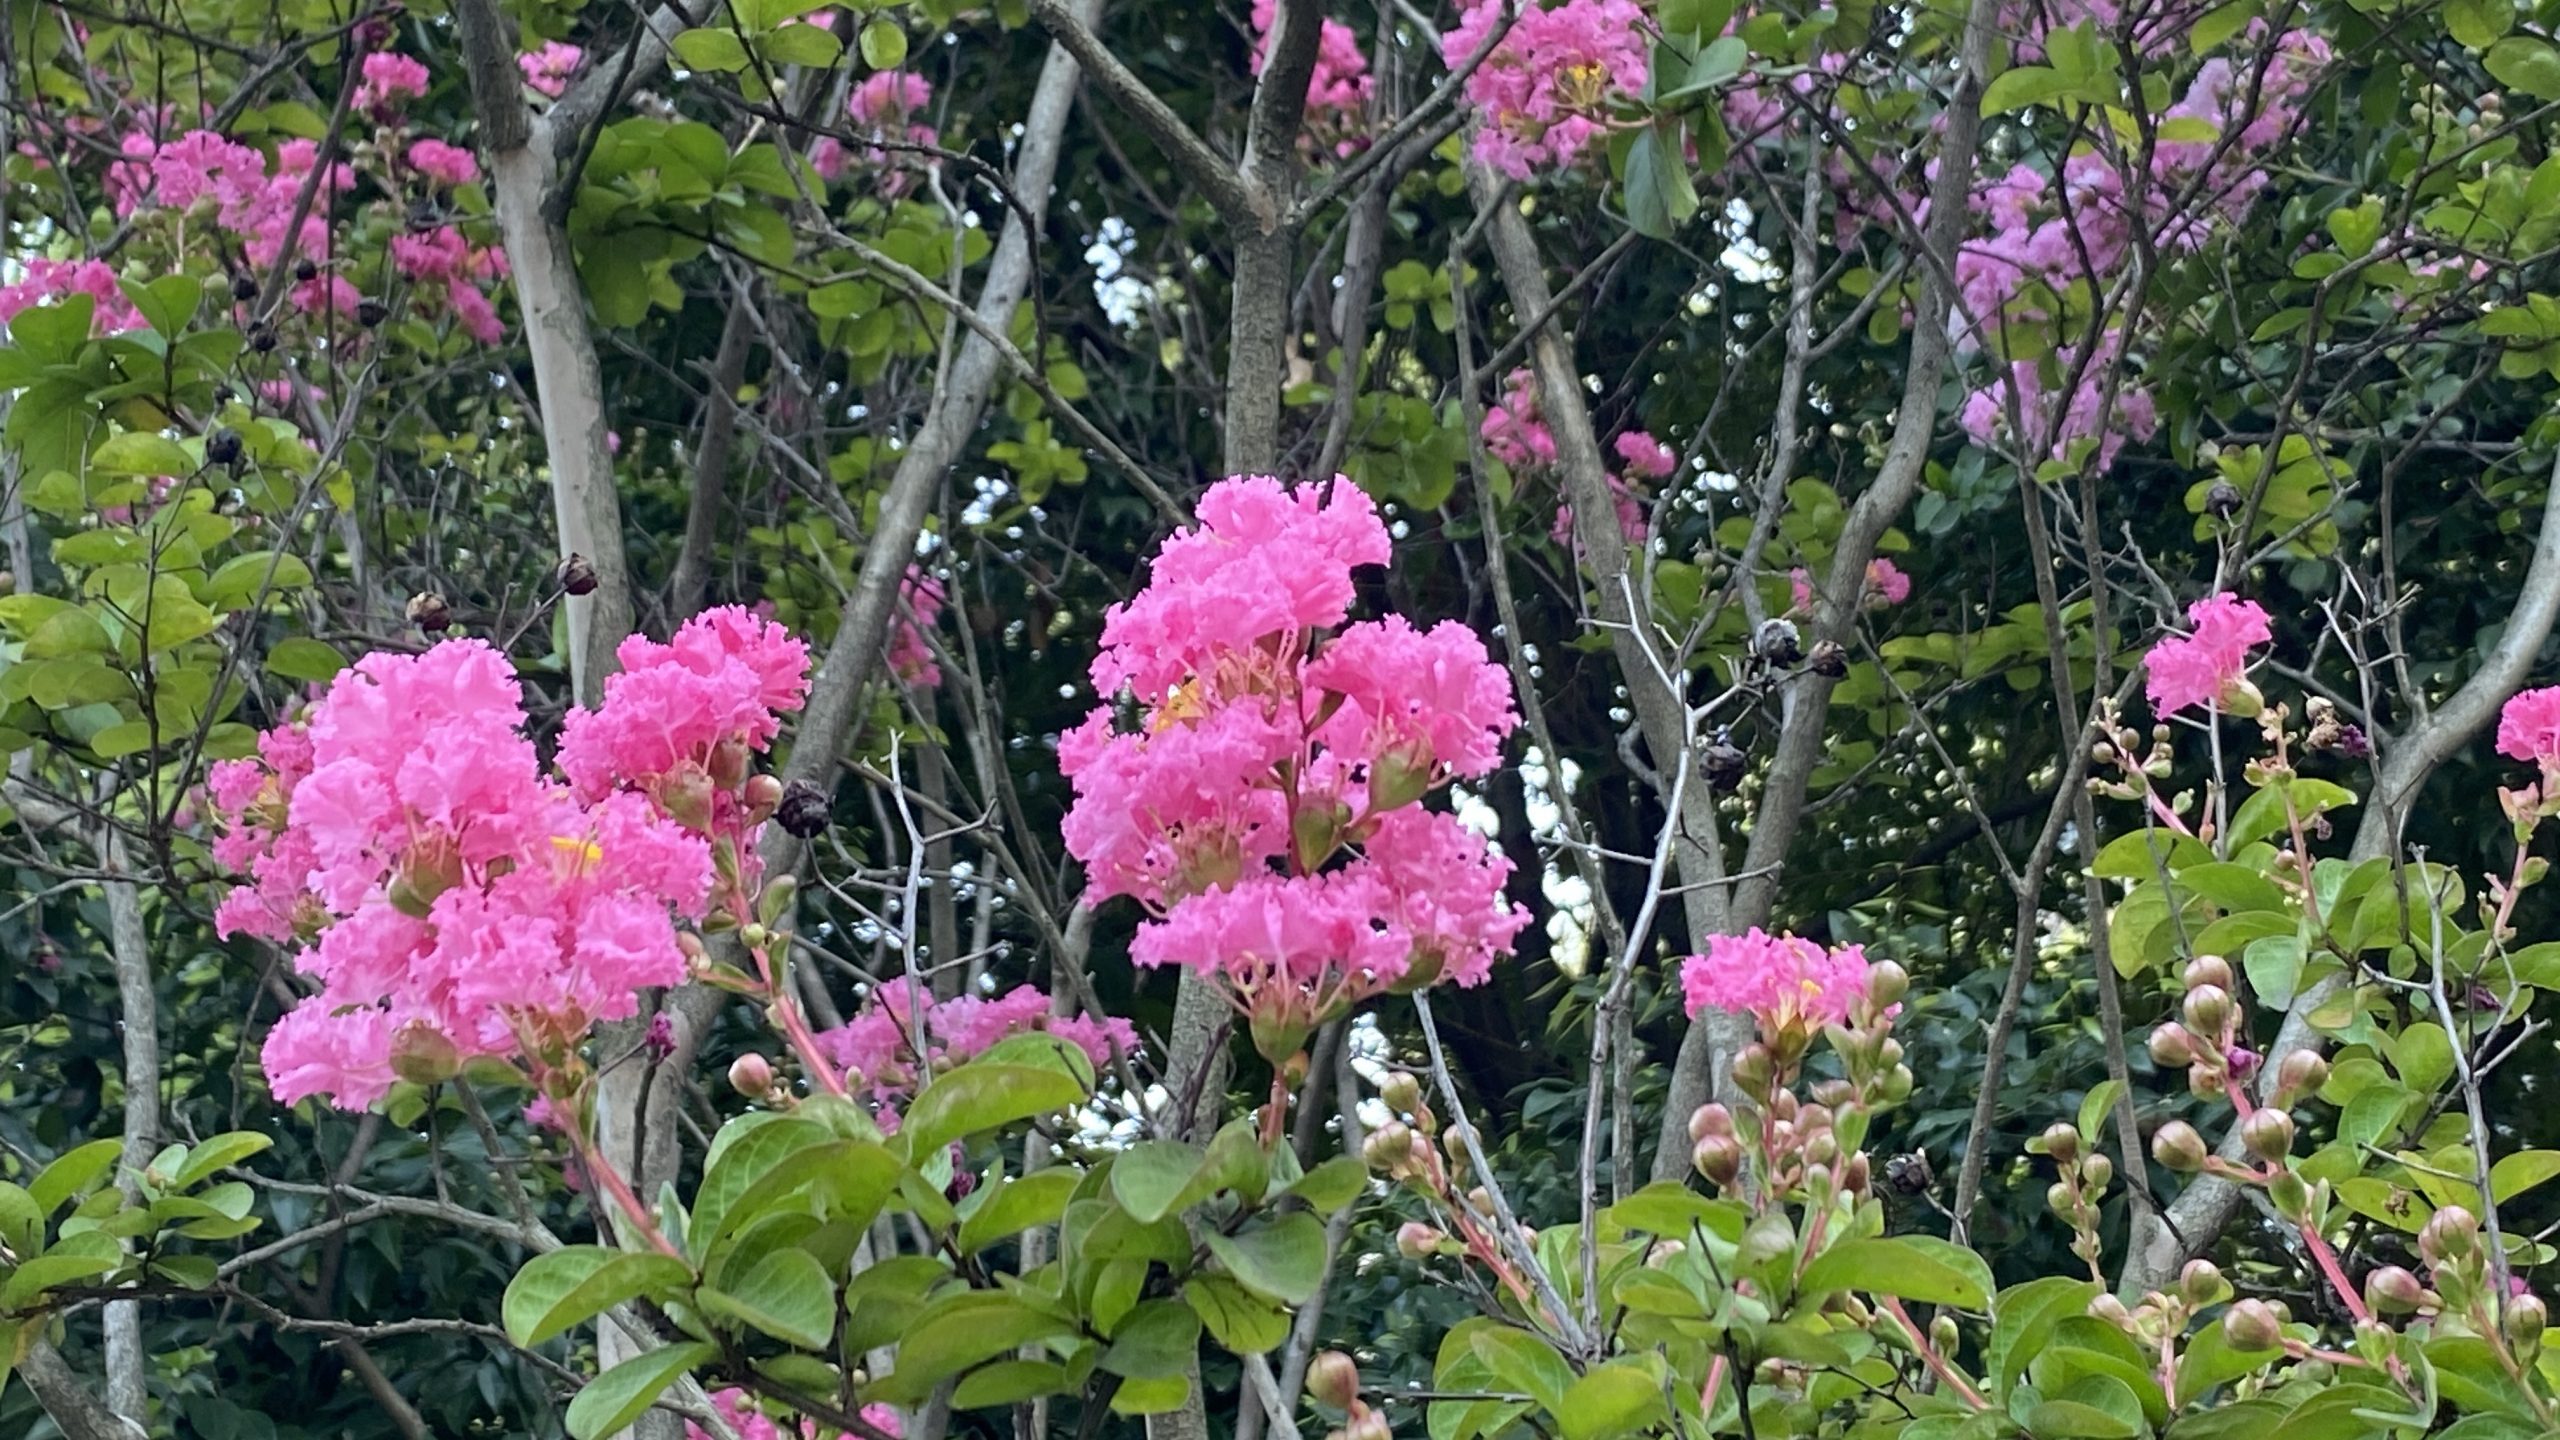
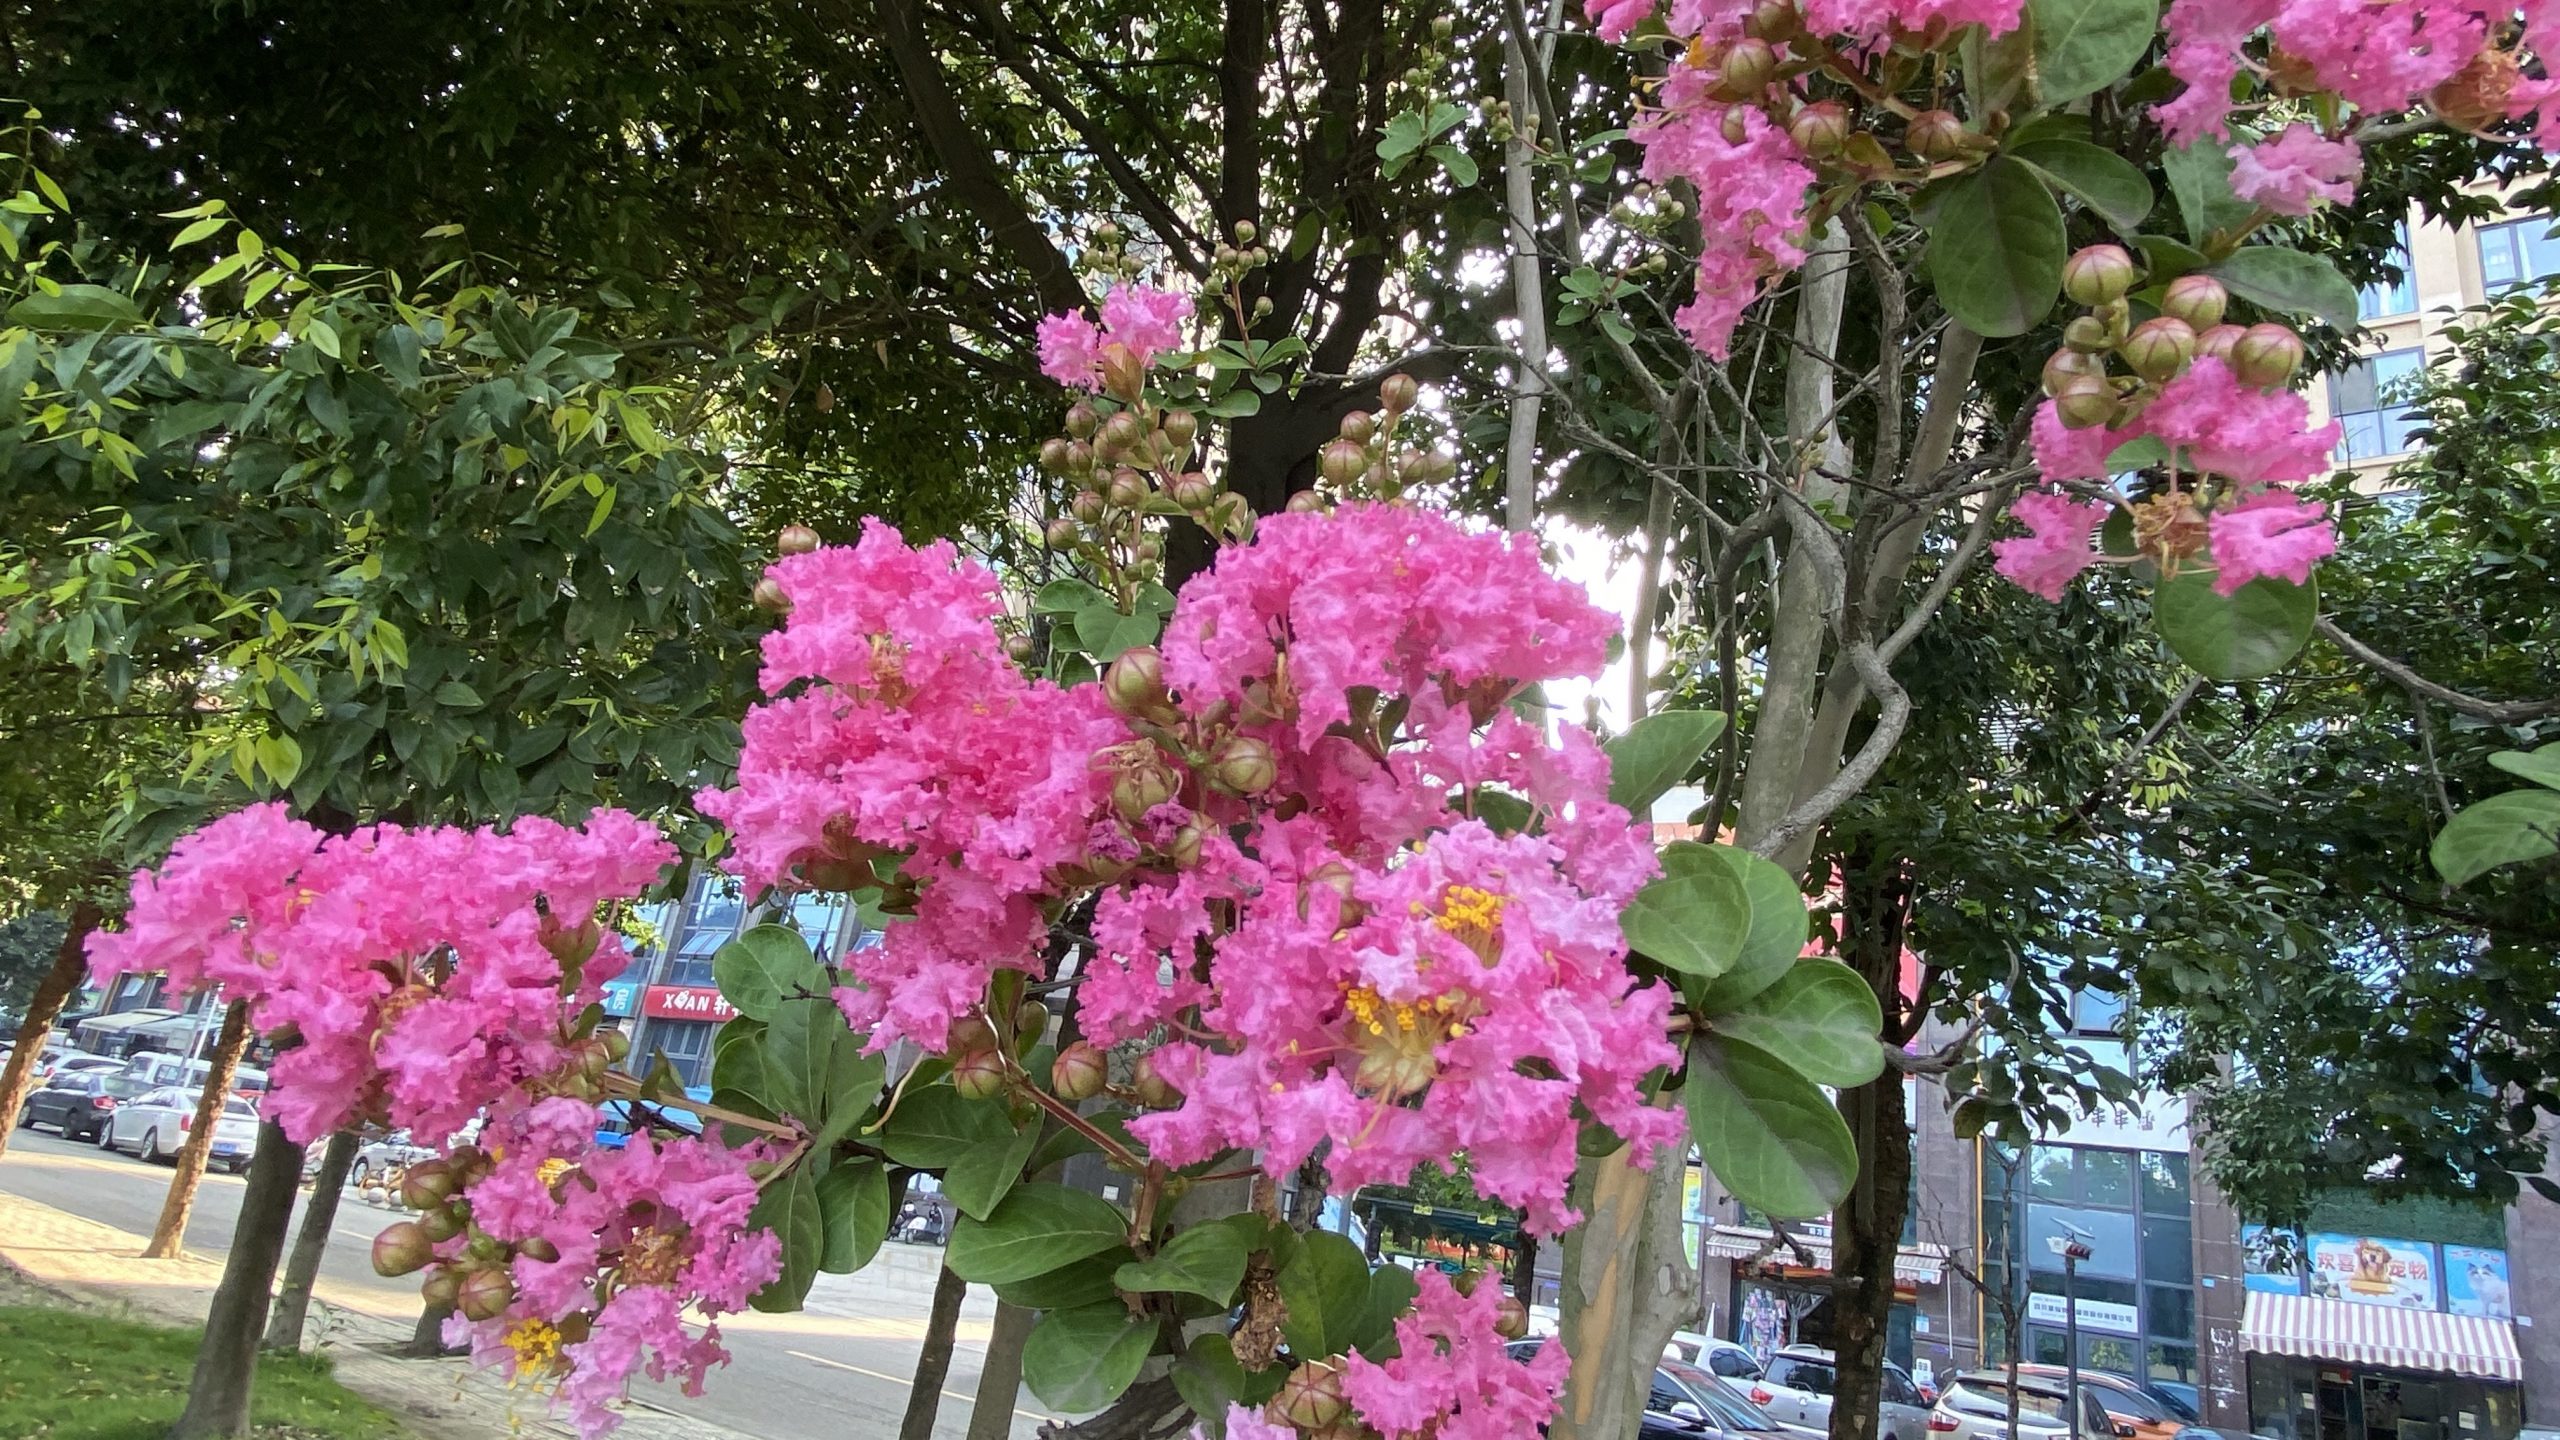
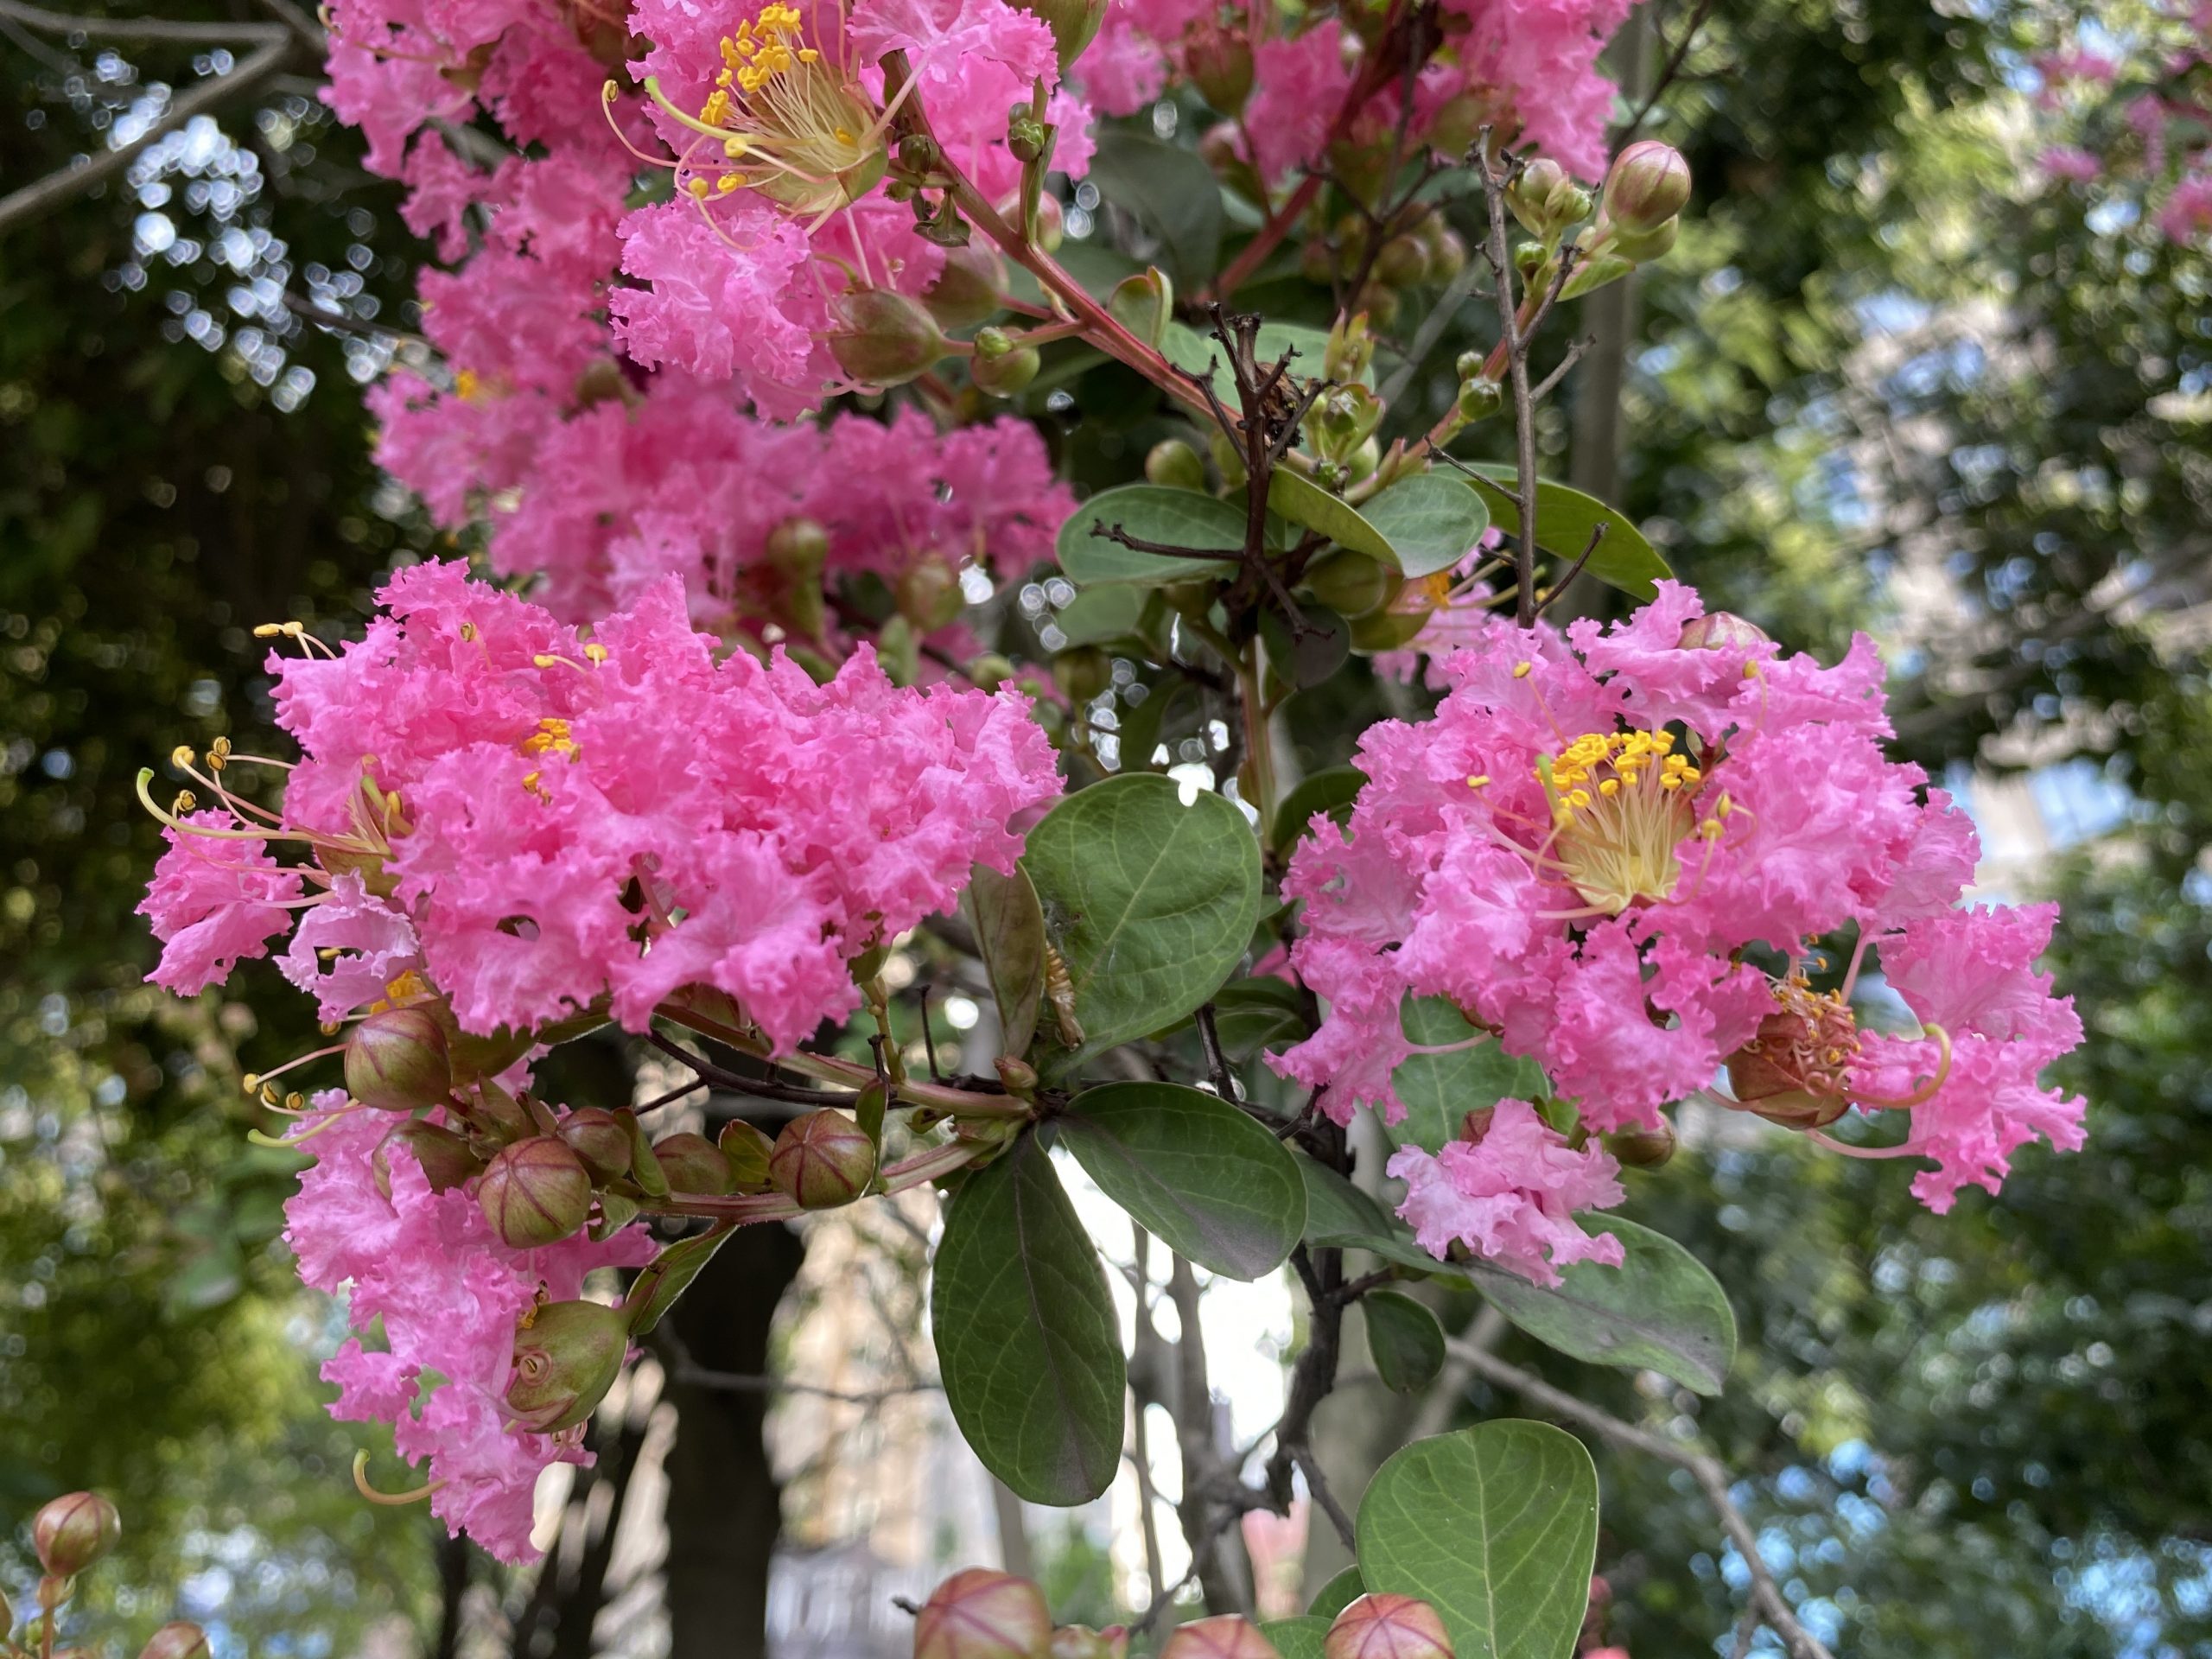
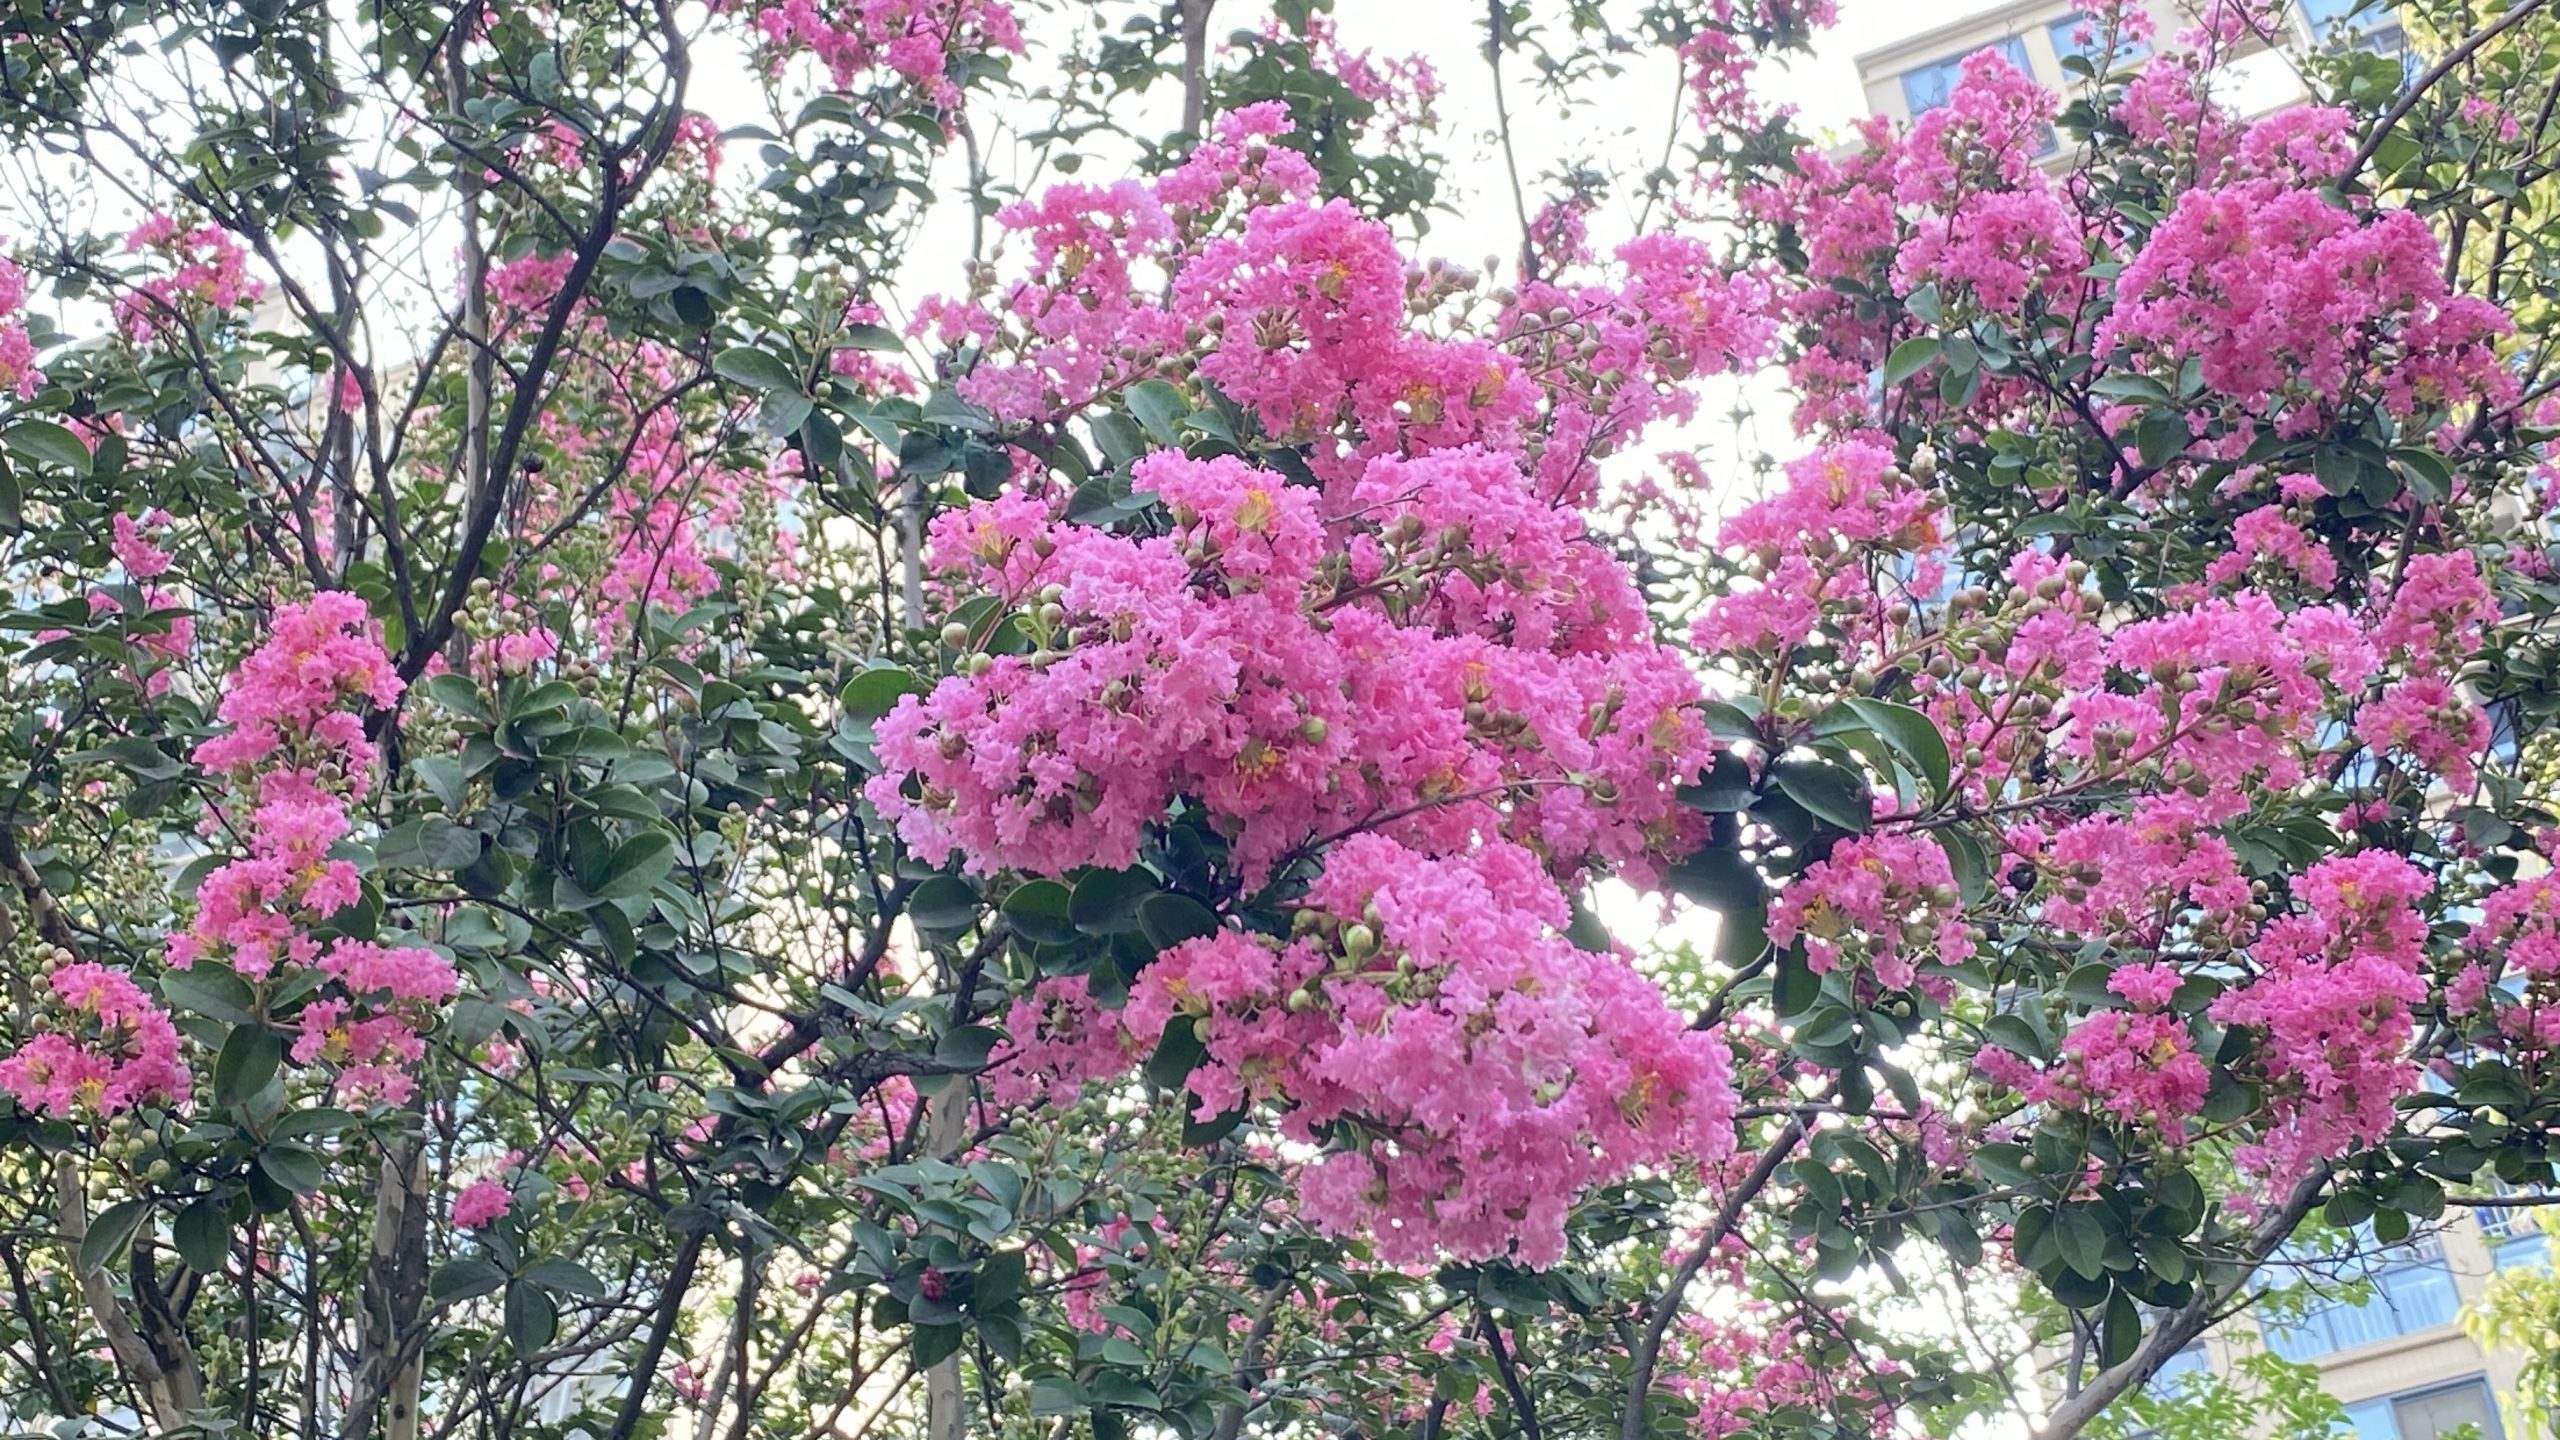
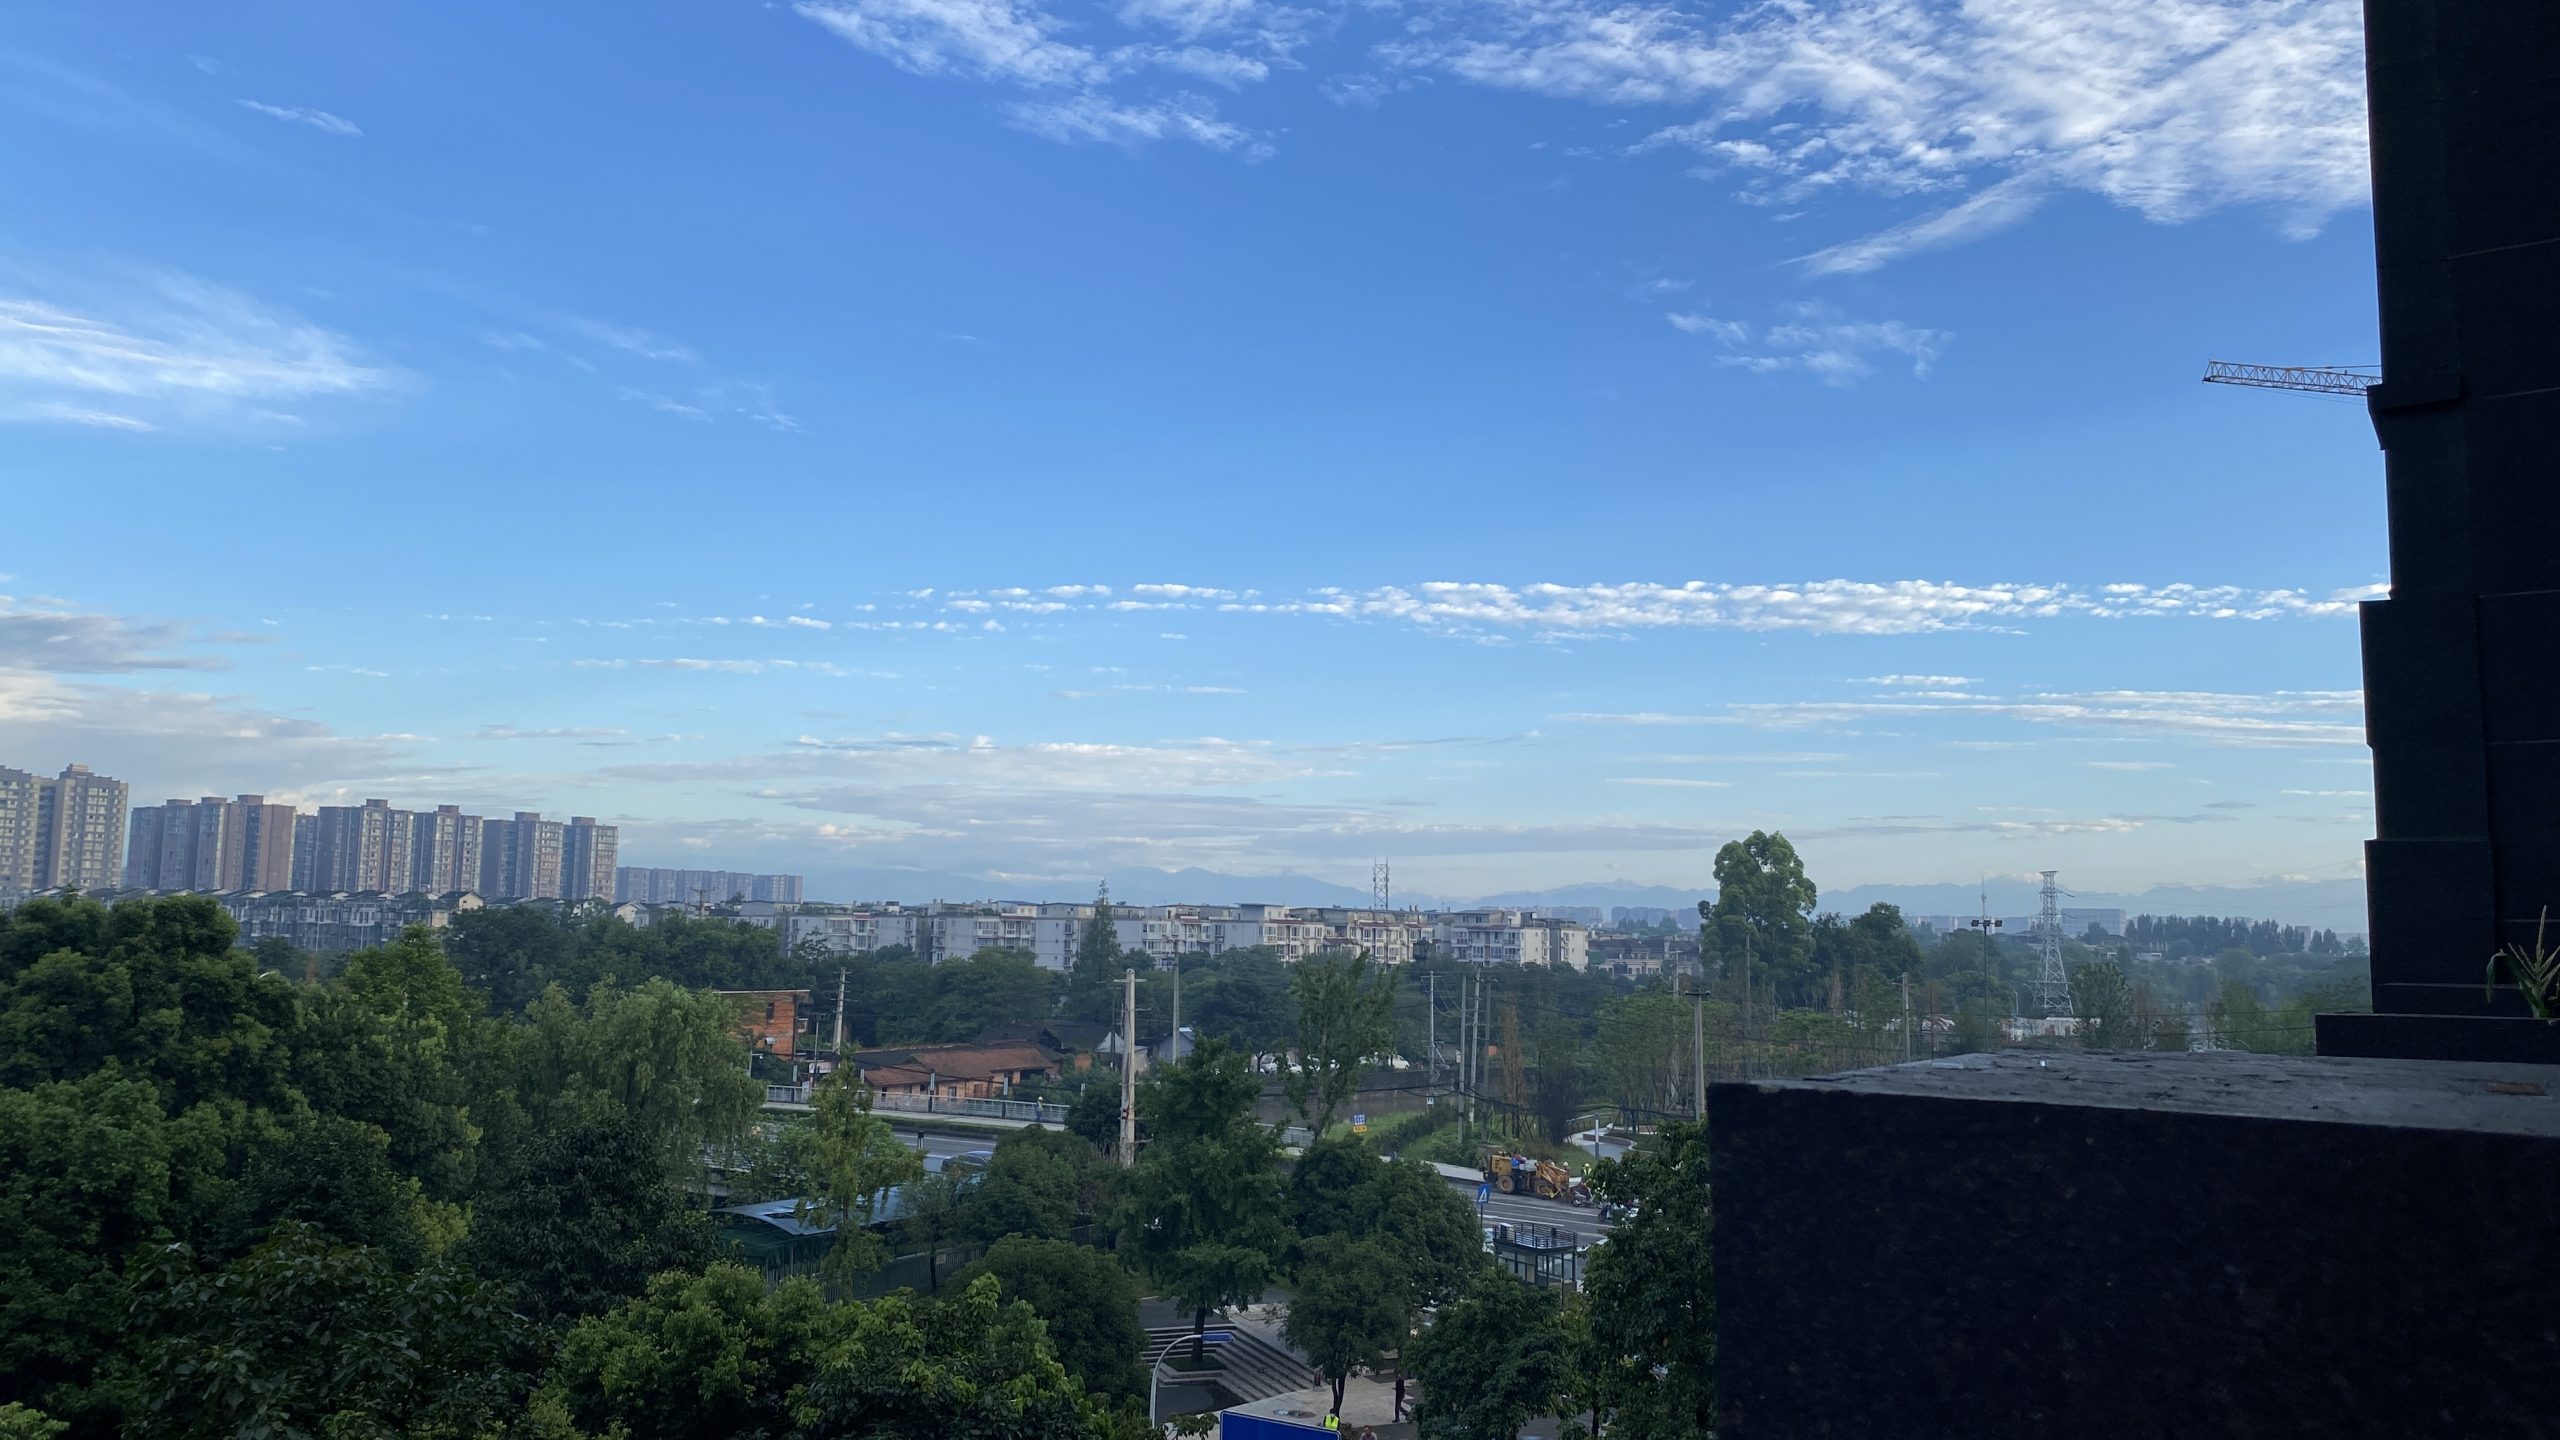
路旁偶遇盛夏的一抹粉。
孩子走在前面,大人在后面,双手搭在肩膀上或者拉住孩子的衣角,和孩子一起走。边走边念:
牵羊,买羊,
买到河家大洋,
牛屎碰到脚(jio),
问到老板买羊不?
“买一羊”?
“一羊断了角”;
“买二羊”?
“二羊断了脚(jio)”;
“买三羊”?
“三羊四羊随你捉”。
另一个大人从旁边过来拦住孩子,并假装要抱他。
大人翘二郎腿,孩子放置在翘起的脚的脚踝处,同时大人双手扶住孩子或者拉住孩子的手,一边跷腿一边唱:
跷跷,
跷跷,
跷得我的宝宝捡柴烧,
今日捡一担,
明日捡一礁,
又有卖,
又有烧,
金银财宝进荷包。(同时逗笑孩子)

有一个需求,需要对for循环中创建的动态数组进行操作,记录一下历程:
最开始在函数开头定义了循环变量i和动态数组trace,并紧接着用malloc对trace分配空间,在for循环的前一行用#pragma omp for private(i)能编译成功,但结果错误。分析原因是因为每次循环都共享了trace,导致计算错误;
然后将for前定义改为#pragma omp for private(i,trace),编译出现段错误;
https://www.coder.work/article/1564167给出了解决问题的正确方法:先用omp定义parallel块,然后动态分配内存,再用omp开启for循环,结束for循环后释放内存,并结束parallel块。如下:
#pragma omp parallel num_threads(40) private(i,trace)
{ // parallel 块是需要大括号的
    trace=(float *)malloc(sizeof(float)*sz);
    # pragma omp for
    for(i=0;i<len;i++)
    {
        trace=xxxxxxx;
        .......
    }
    free(trace);
}
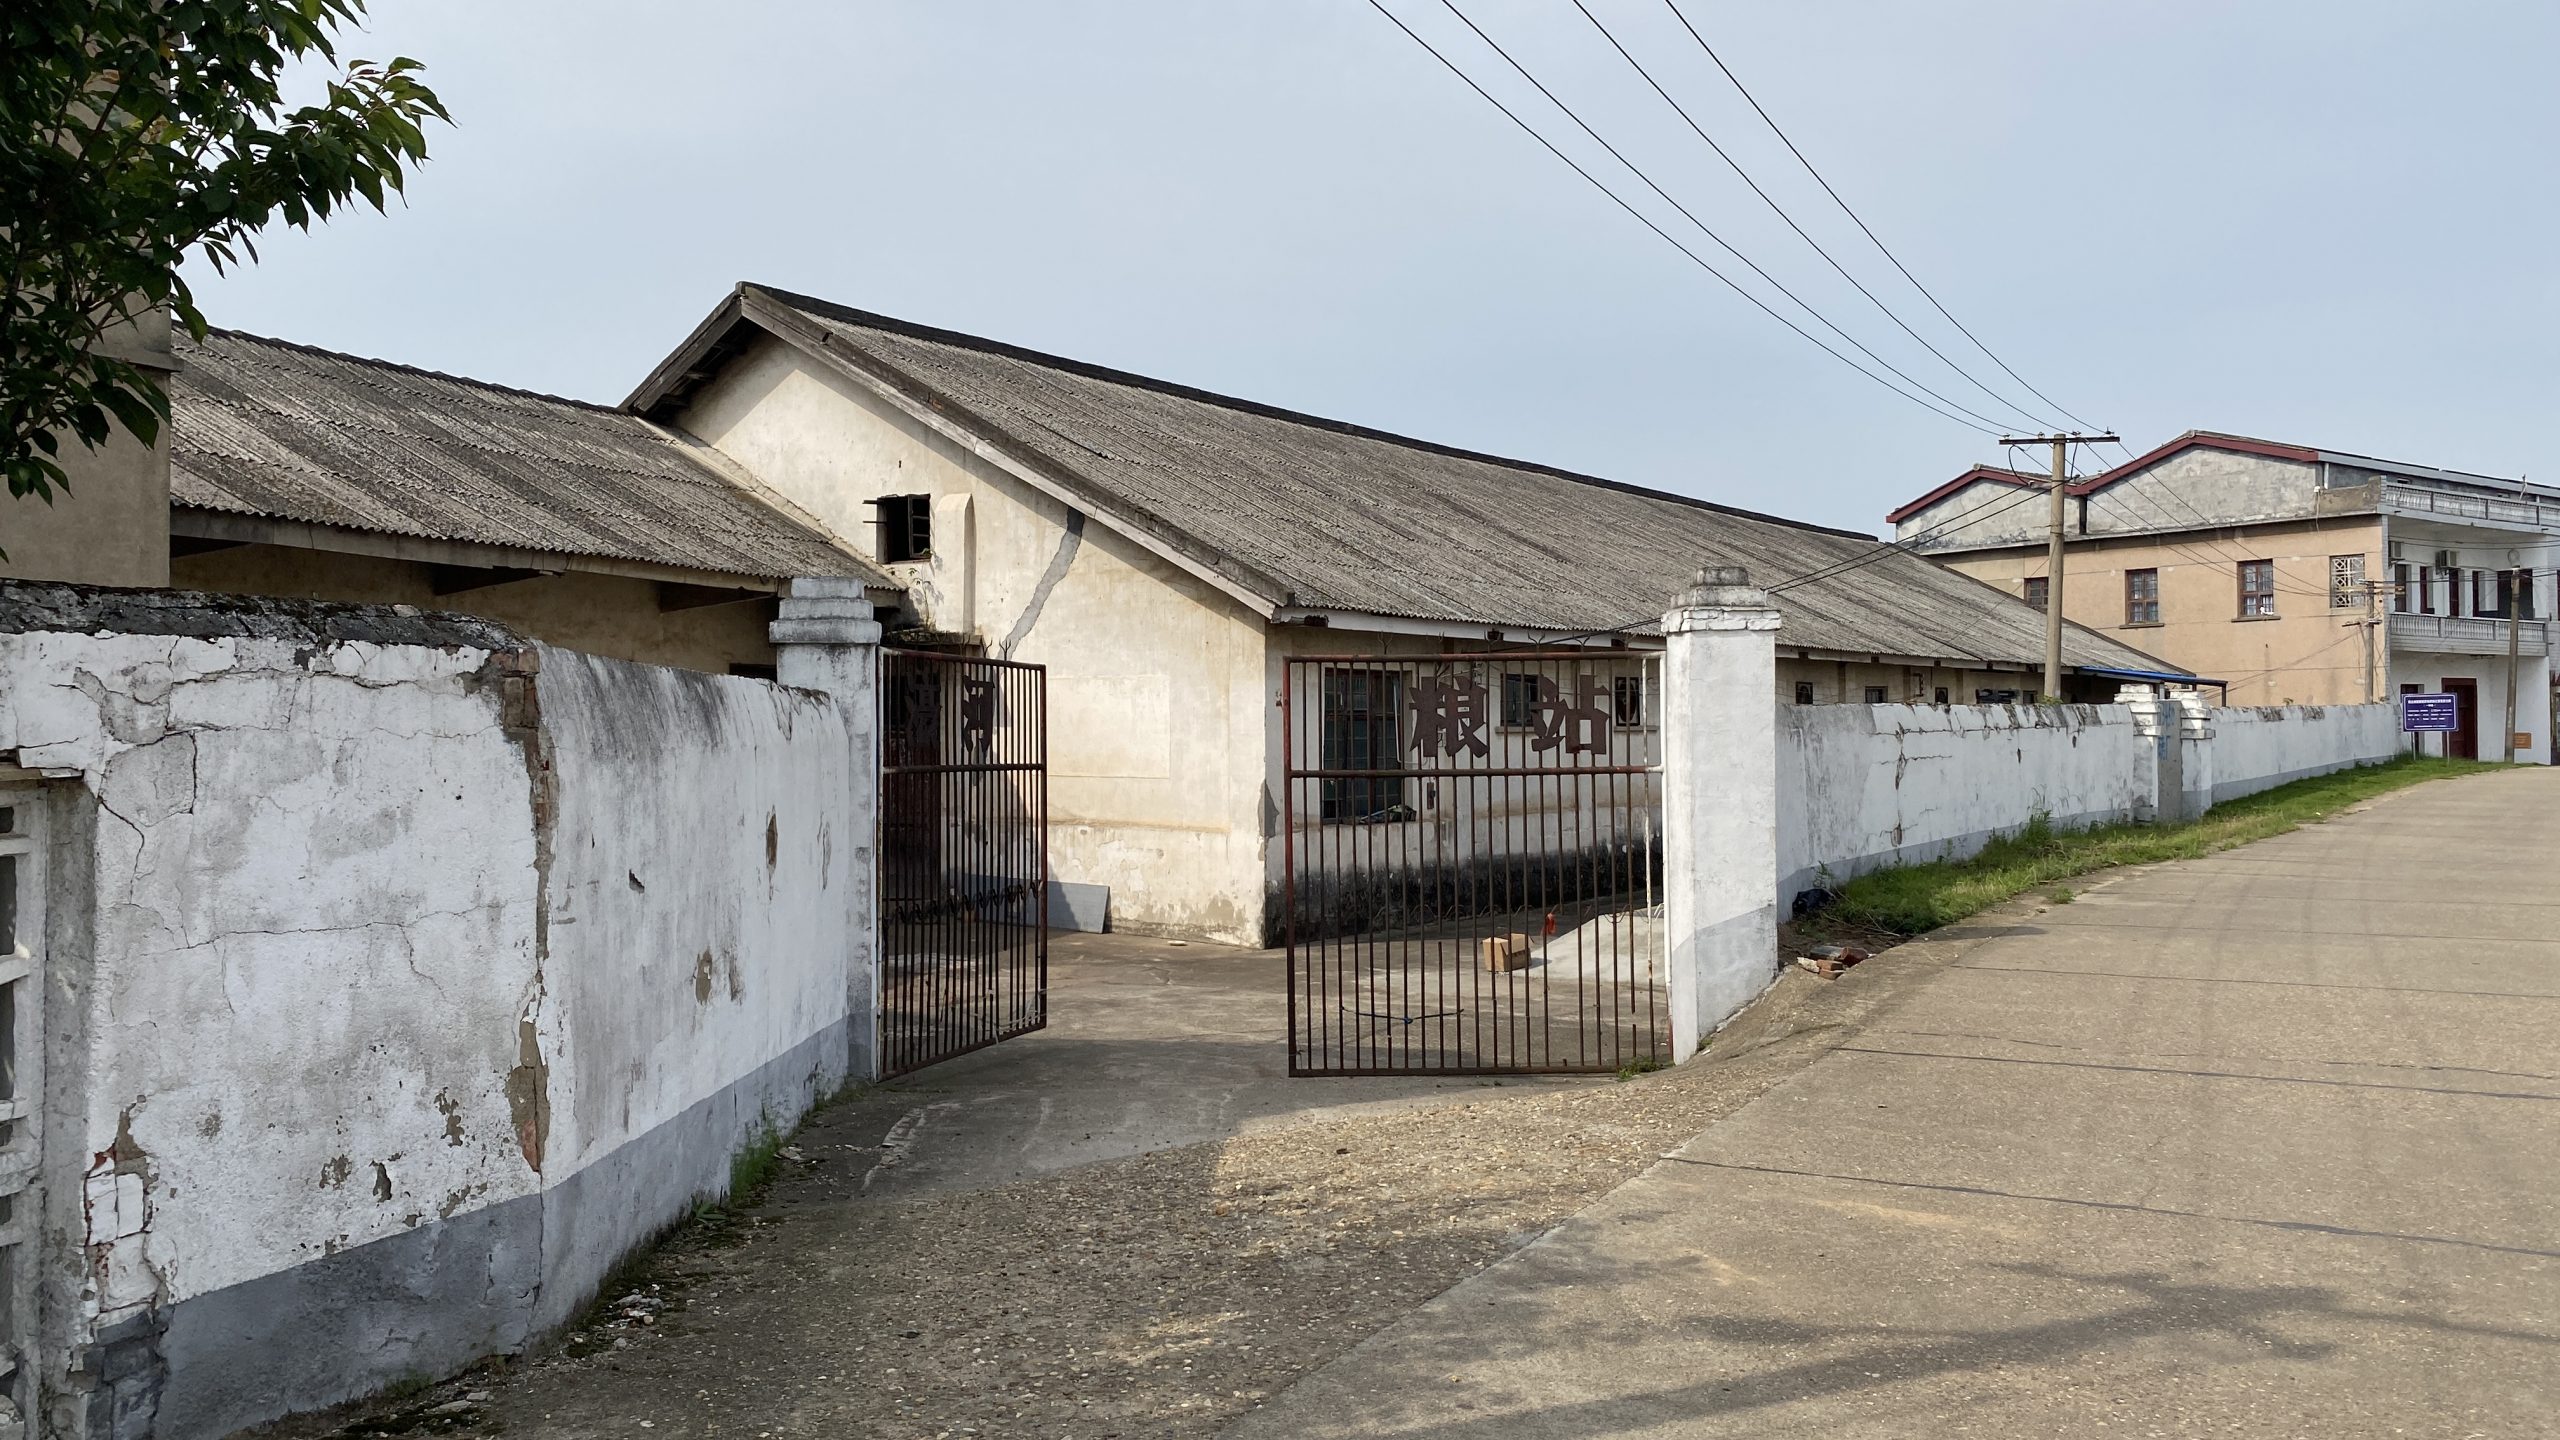
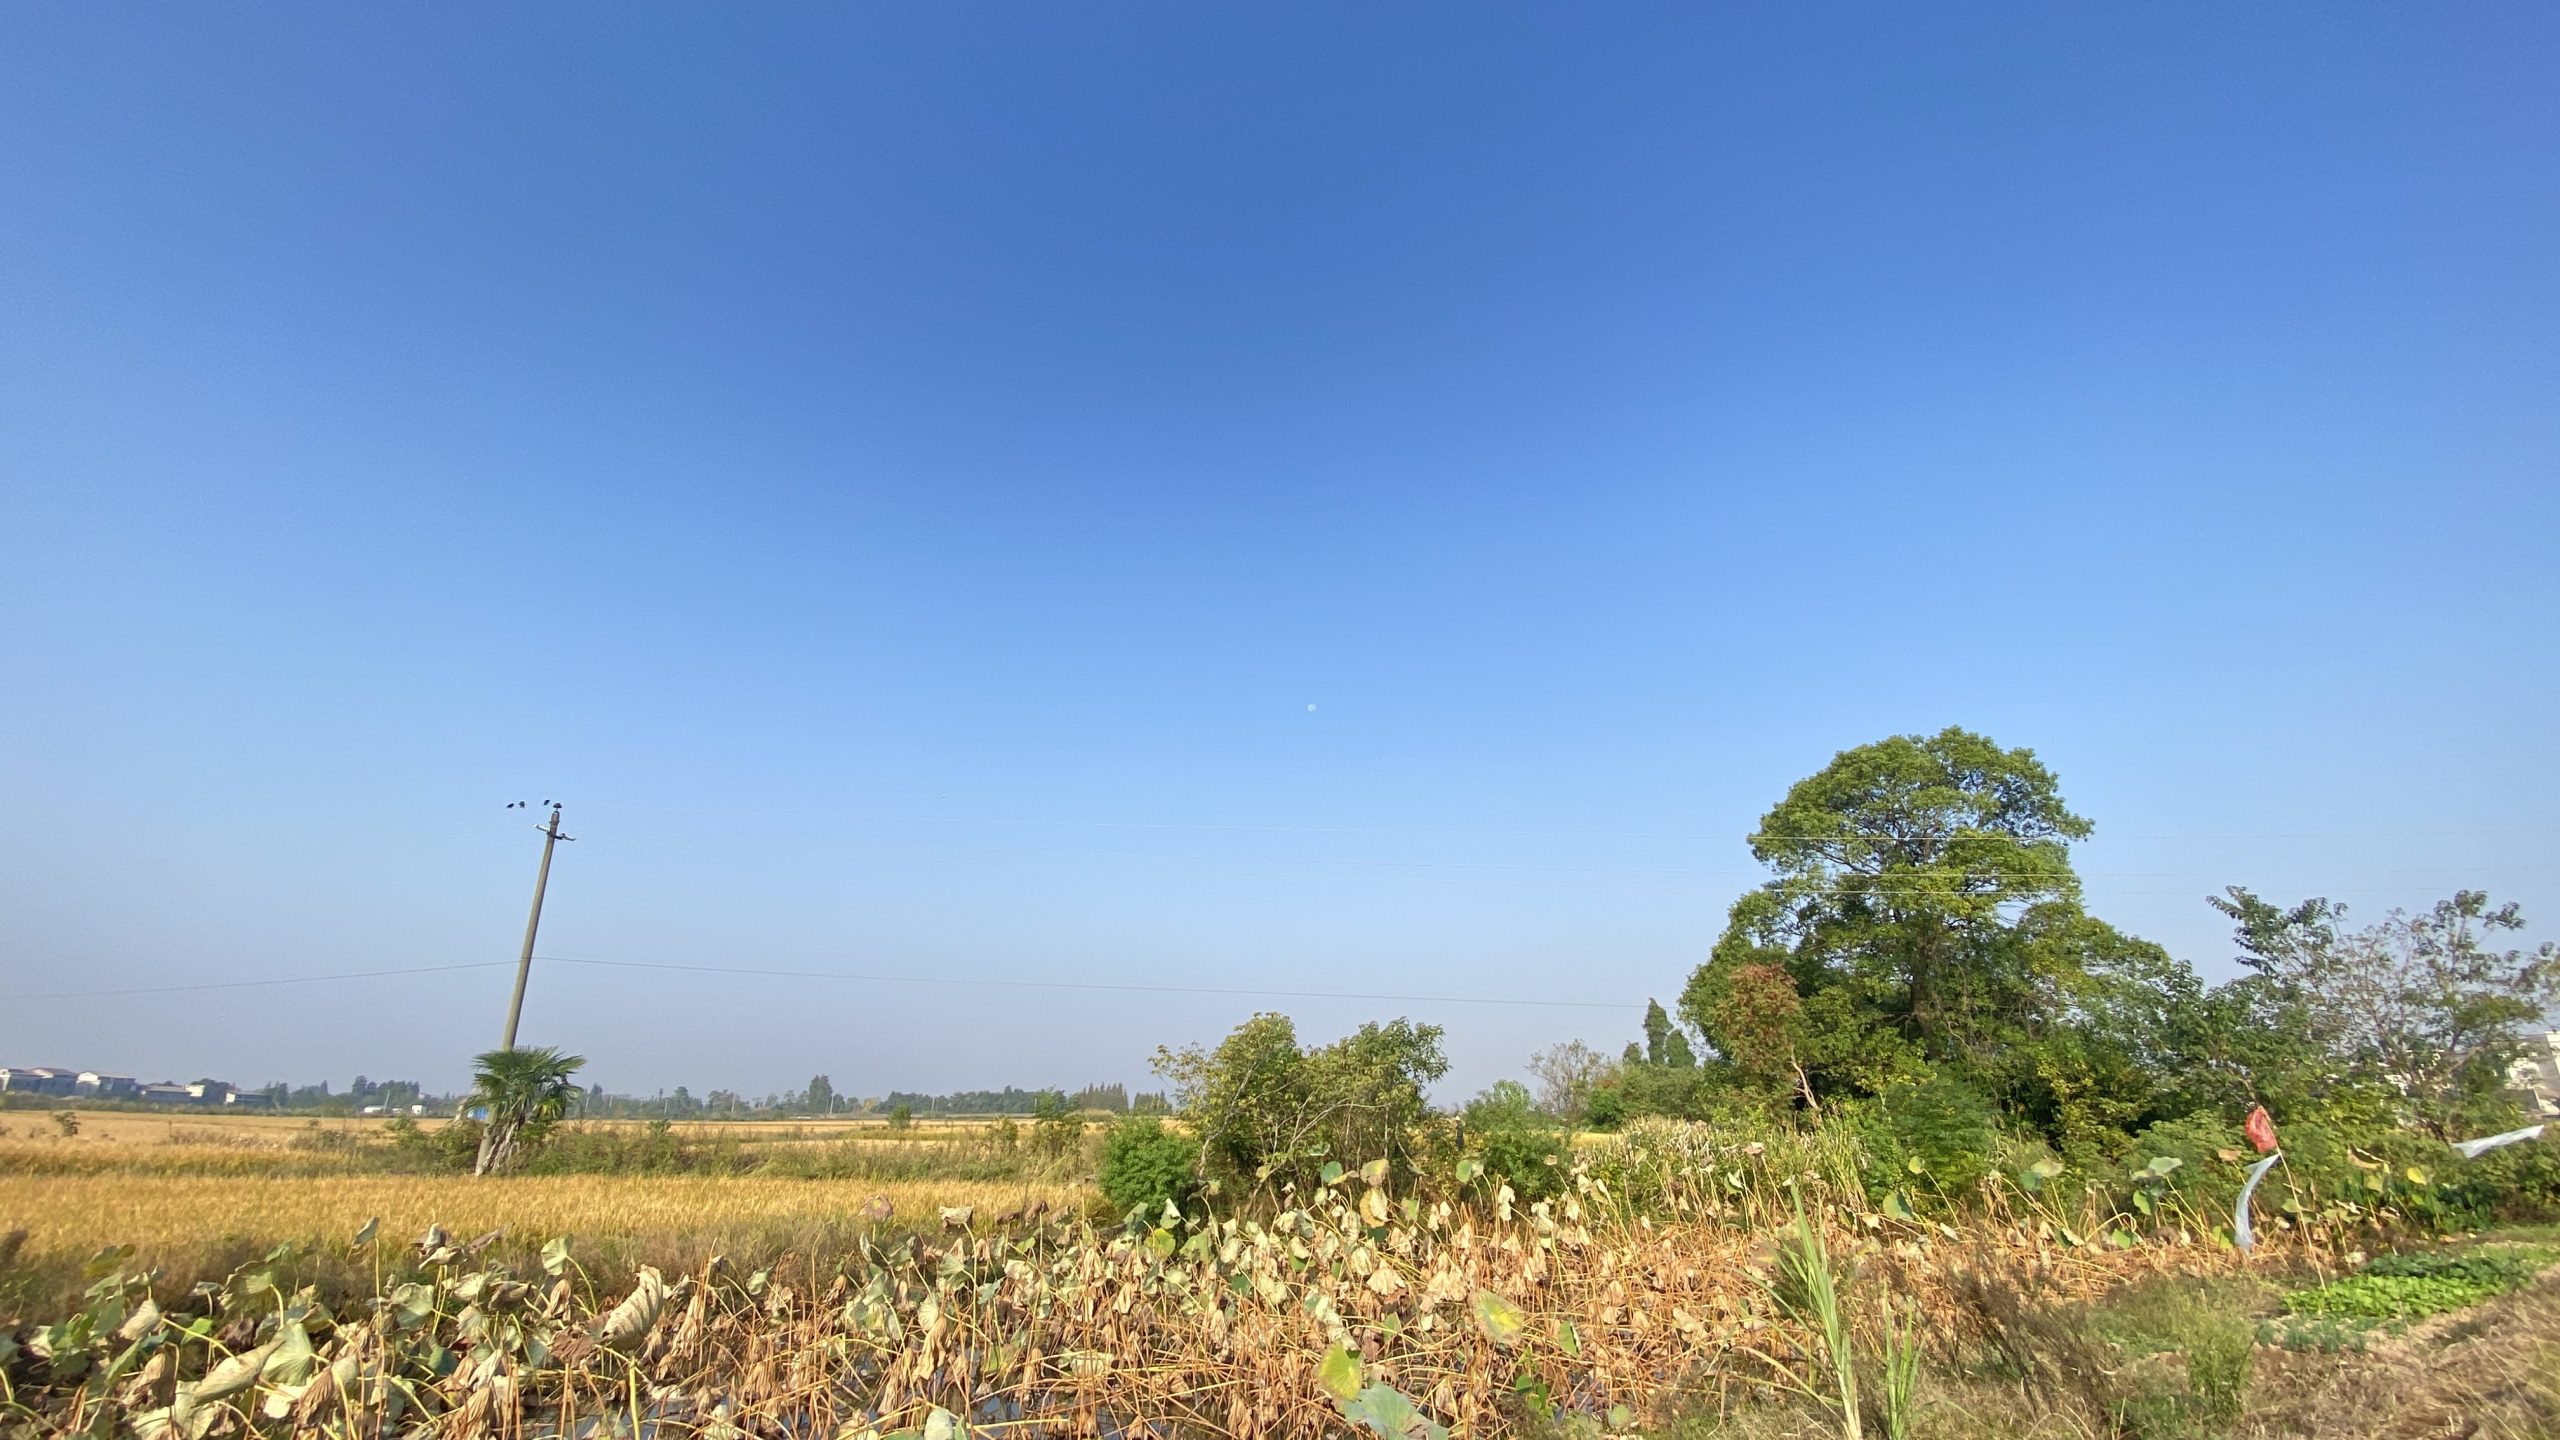
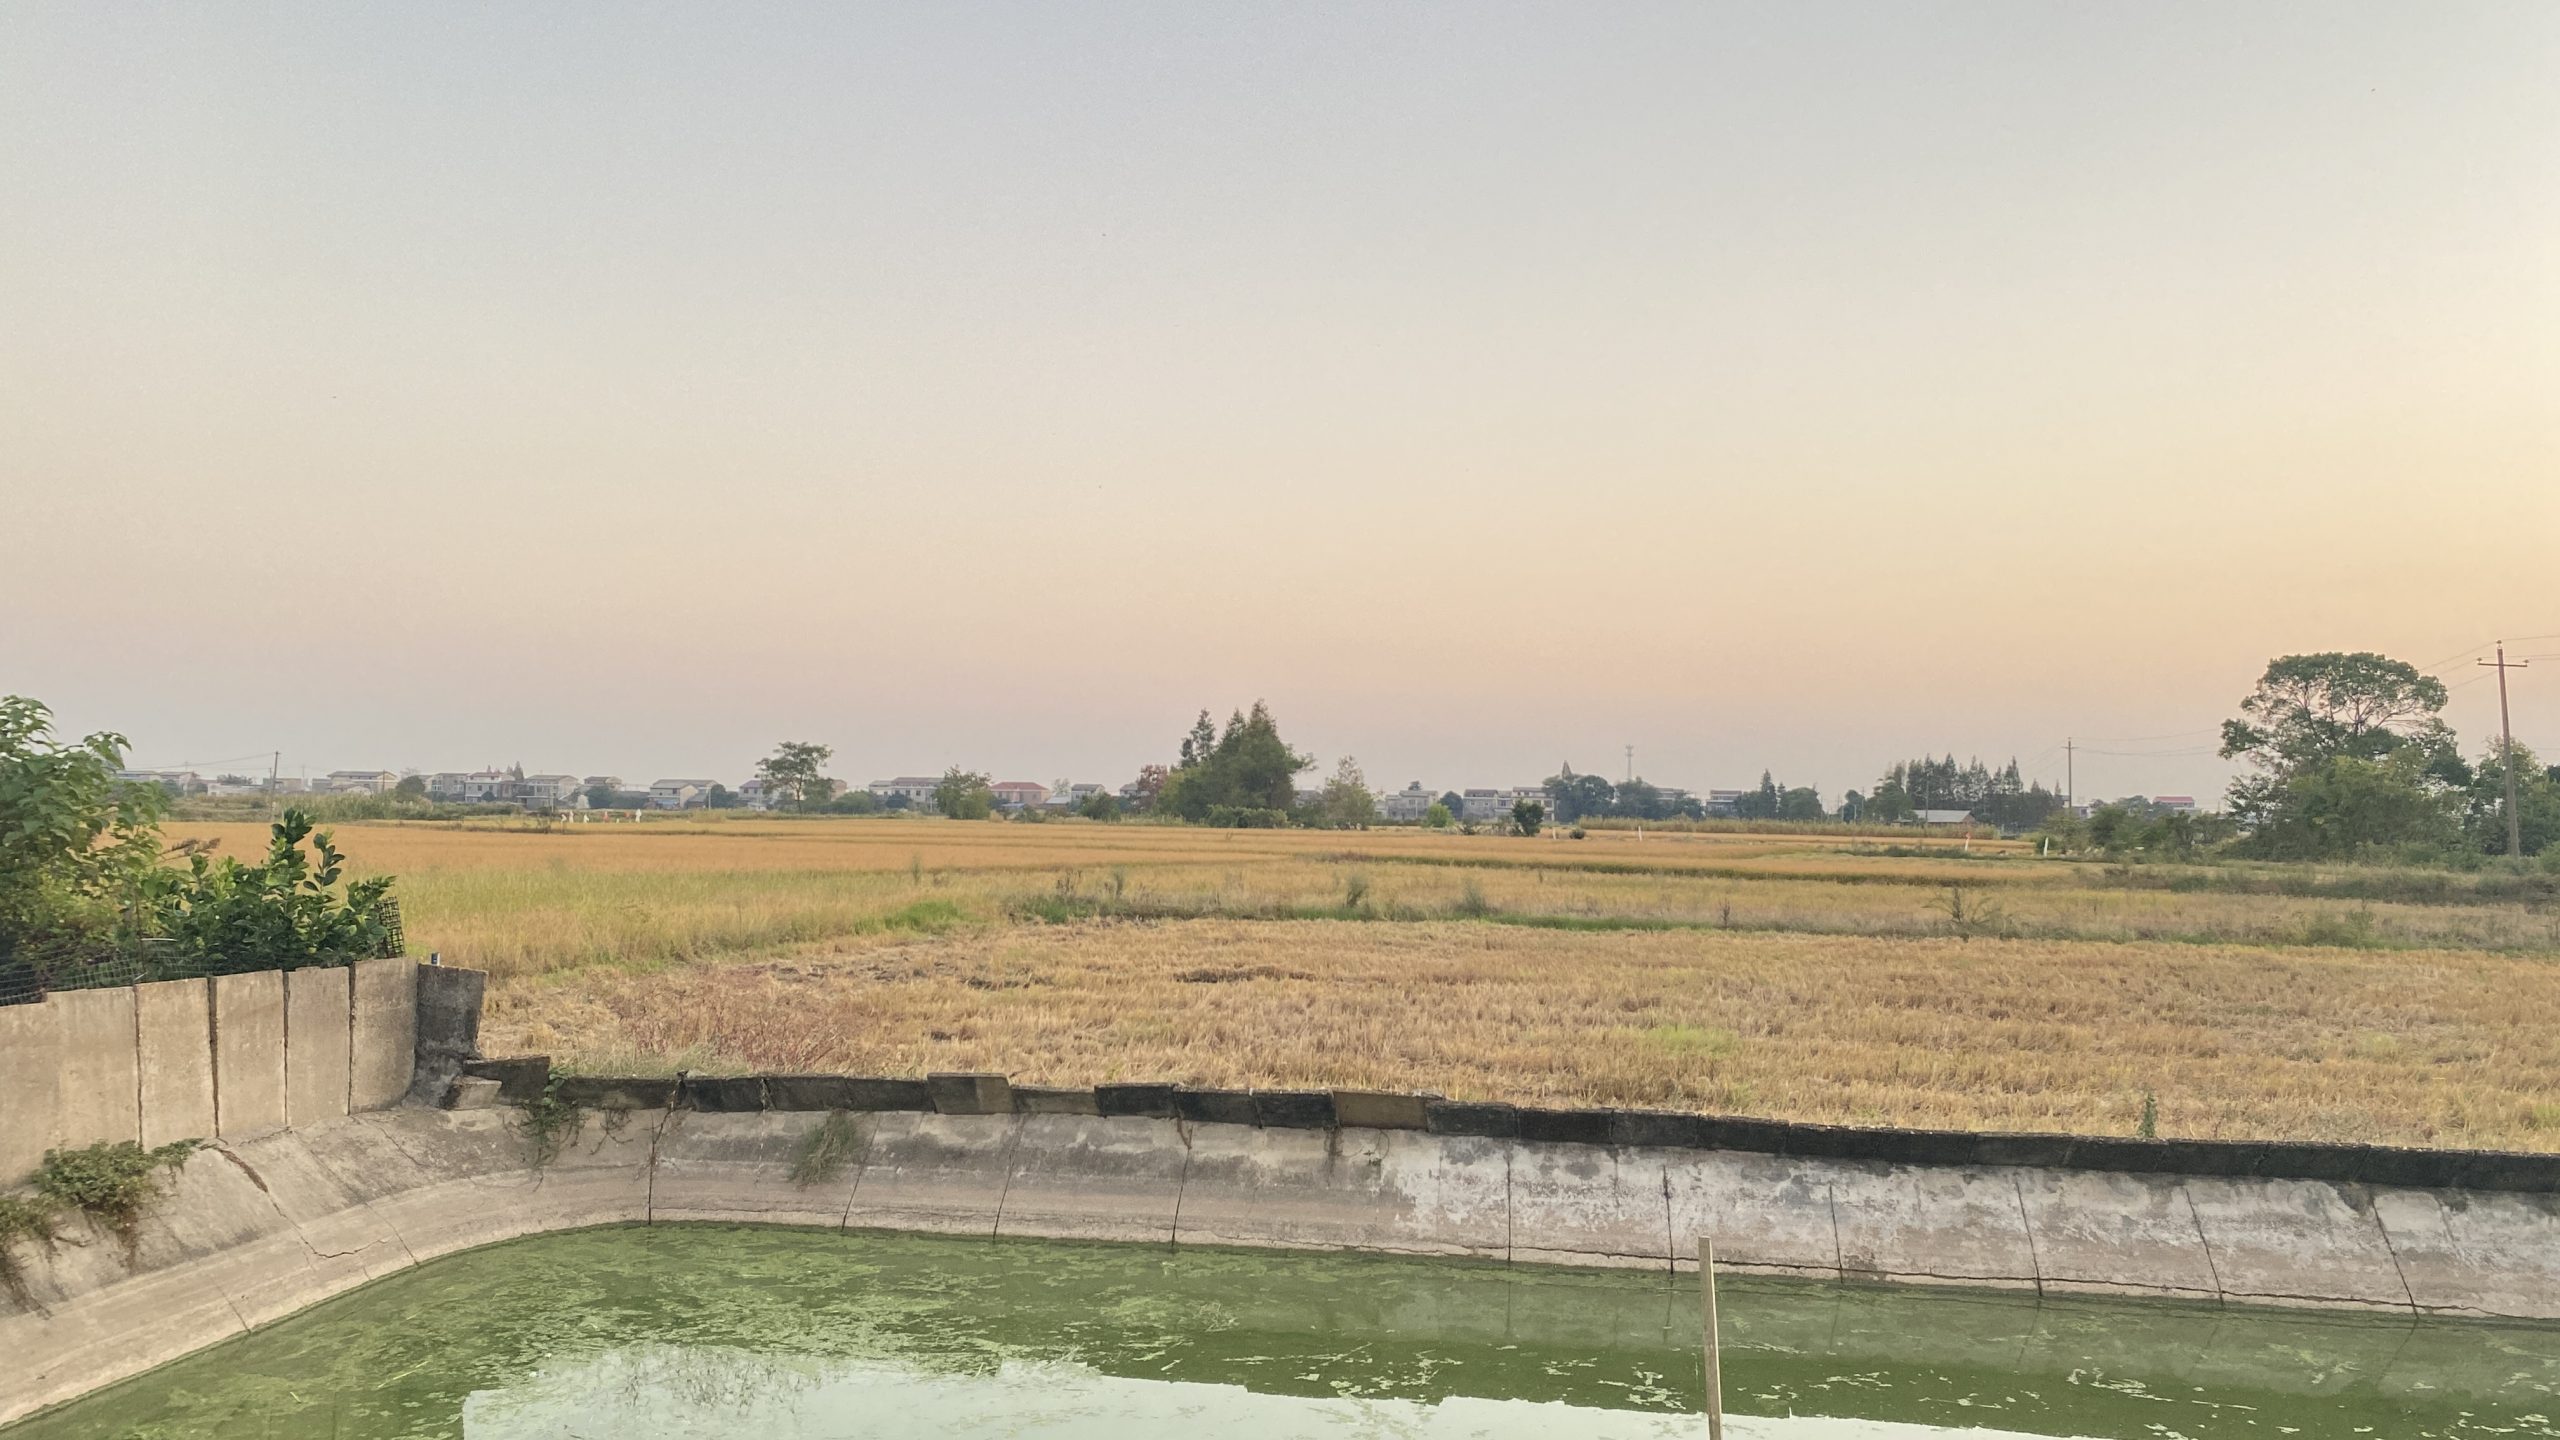
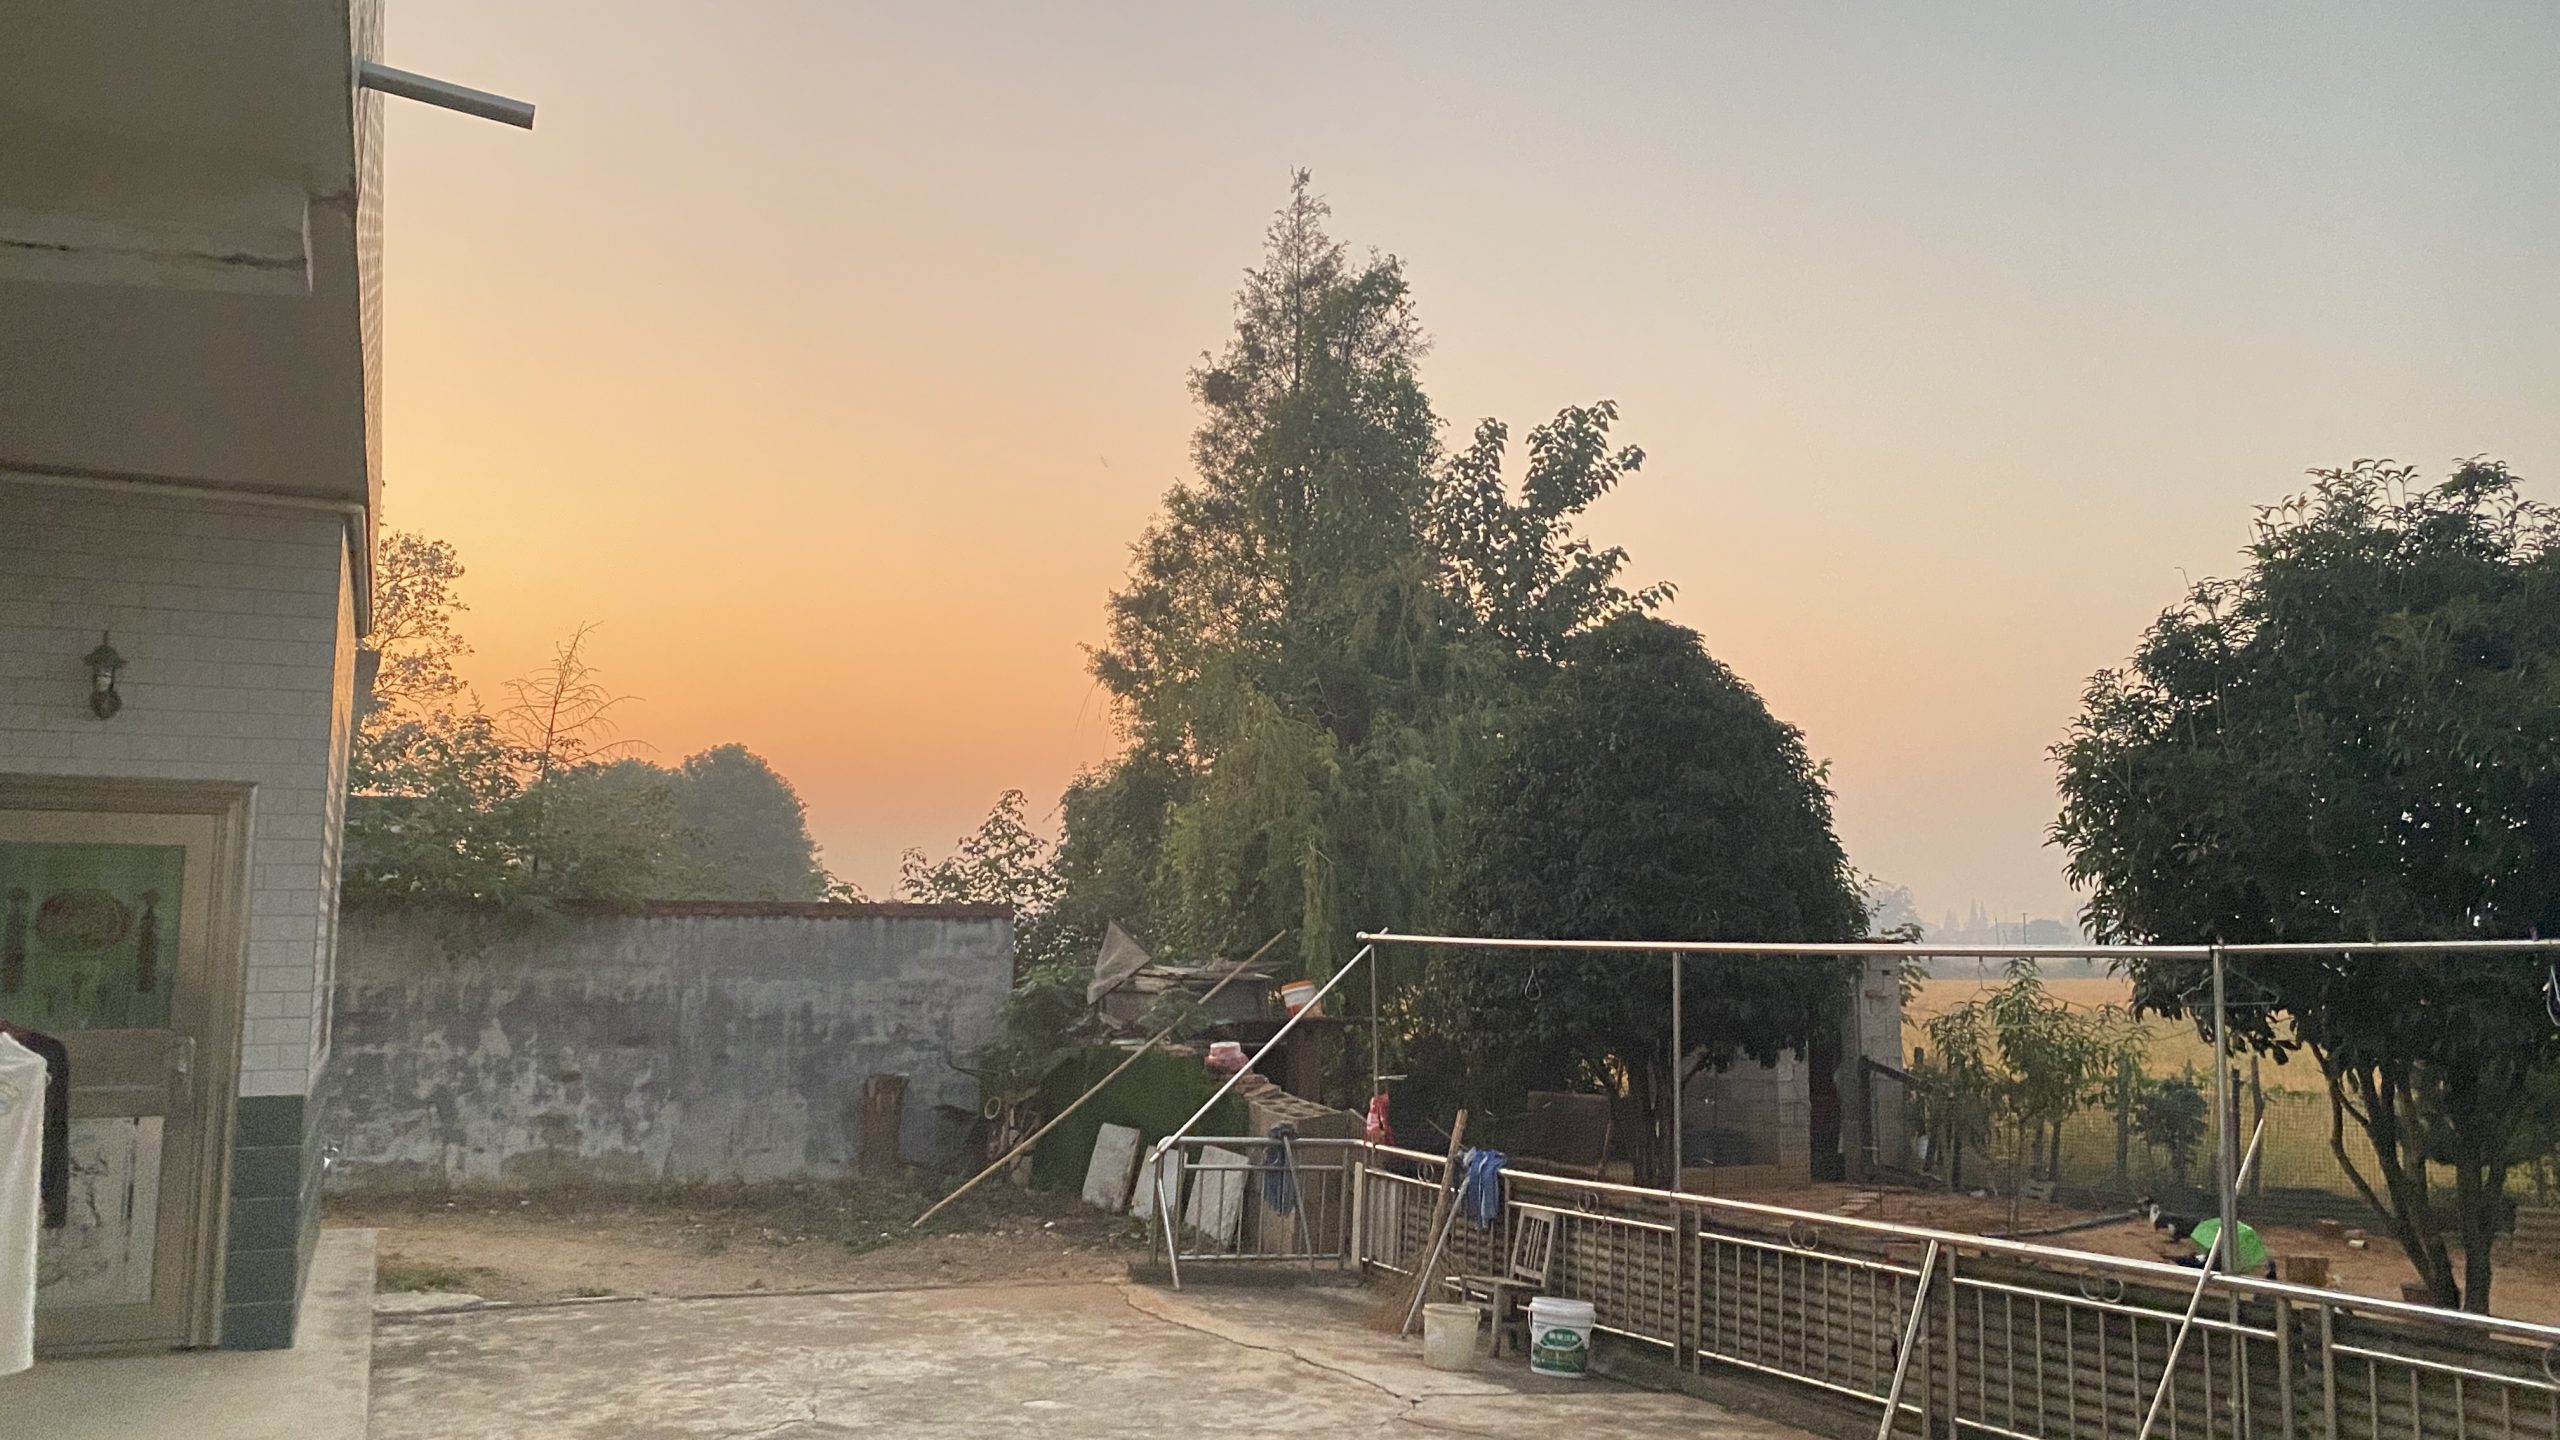
告诉一脸茫然的孩子什么是粮站,什么是交国家粮,什么是农业户口。
孩提时一年中最盼望的时段除了过年,就是年中的时候跟着祖辈和父辈去交国家粮了。辛辛苦苦收割、扬场、晾晒好早稻谷子,然后自己花钱租车送到粮站。粮站有那么三五个工作人员站在门口,手里拿着某种漏斗似的金属器具,扎破送粮人家的蛇皮口袋或者麻袋,从漏斗中取出粮食,把玩品鉴一番,再丢几粒入口咂摸几下,吐出个好歹来——至坏的退转回去,换上好的谷子再来;其余的大部分,无非就是现场晒晒(当时日头好的话),或是再扬场吹吹空稻壳;也有或许是极好的,直接入仓。若是过关,便又挑着框抬着袋将粮食运往仓中。长辈们说门口那些人都是吃国家粮的。交粮完毕,家人随着空车带着空容器准备动身回来,还有那页戳着红章的收据。
而我的兴致此时才来,粮站外赫然地排列着几处西瓜摊。当时也有些思想活络的人已不愿老实种粮食了,累且收入不好,便开始种起了如西瓜等经济作物。然而国家粮却还是要交的,于是索性在粮站门外摆起摊来,用西瓜换粮食。一般家庭交粮,会尽量足额且剩有余量。我望着车里那剩下的浅浅一抔稻谷,央起了家中长辈。那时候,夏季的西瓜简直比雪糕还要难以吃到,不光是少,更重要的是穷。我记得幼时是有那么一两次在交粮时是吃到了西瓜的,而后,就是失望了,失望到我年龄渐长,都不觉得这是一种失望了,而这事本身却在我心里刻骨铭心了起来。
这两年得空带孩子回老家,无意中游览到了这里,给他讲起了往年的故事。我也开始站在长辈的角度来看待当年的事情了:辛苦劳作的成果被剥夺后的无奈与沮丧,在那一过程中,是很难有心情将剩余所得犒劳自己的,我很感谢他们给了我甜蜜的回忆。几年前国家废除了农业税,而后又取消了农村户口,家里人似乎淡然了起来。没有交粮的要求,便更新了更轻松的耕种方法,多余的粮食也可以养殖更多家畜,人也有了更多清闲的时间。事情似乎在变好,但,人也在变老。